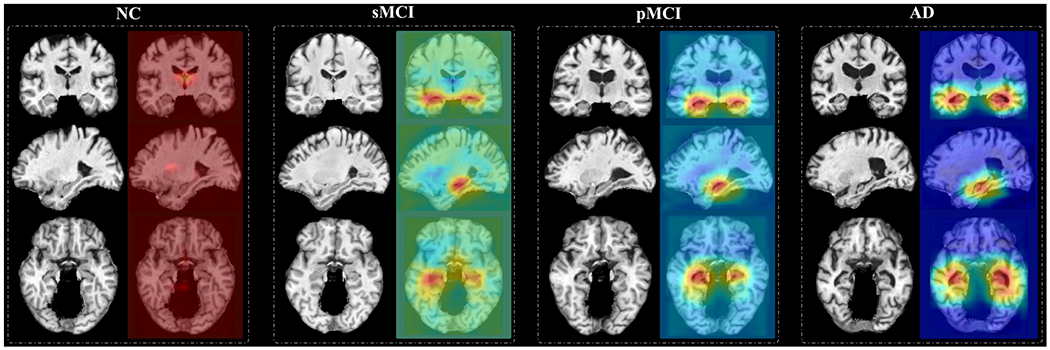
Fig. 8.

Attention maps produced by our MWAN for four subjects with different category labels (i.e., NC, sMCI, pMCI, and AD), respectively. The attention map for each subject is shown in three views, where red and blue denote high and low discriminative power, respectively.
