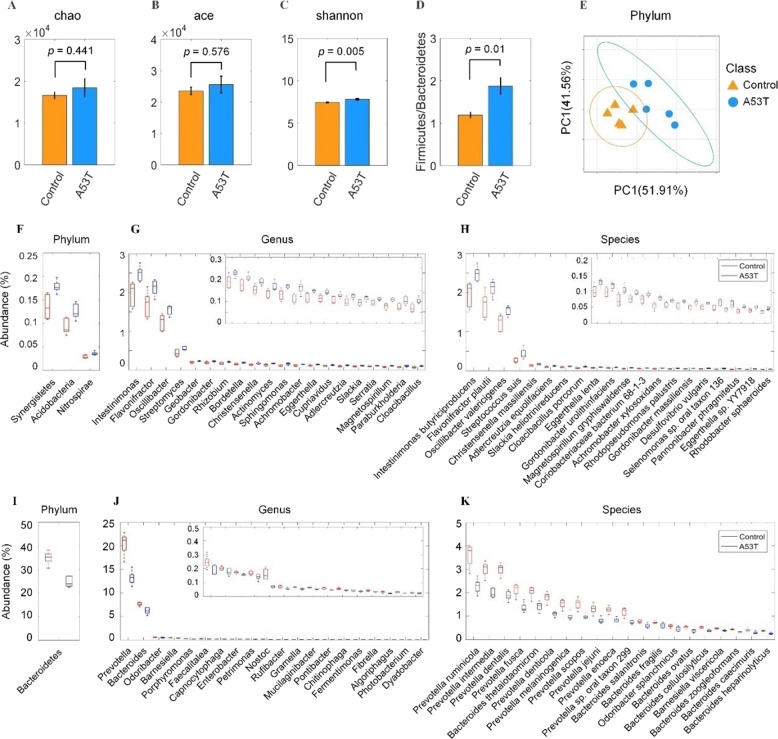
Fig. 1. Phylogenetic profiles of gut microbes in A53T transgenic monkeys.
A–C α diversity including Chao index, Ace index, Shannon index. Shannon index significantly increased in the A53T transgenic group compared to the control group (p < 0.005). D The ratio of Firmicutes to Bacteroidetes increased in the A53T transgenic group. E An obvious separation between the A53T transgenic group and the control group was observed by β diversity analysis. F, G, H The phylotypes significantly increased (p < 0.05) in the A53T transgenic monkeys at the phylum, genus, species levels. I, J, K The phylotypes significantly decreased in the A53T transgenic monkeys at the phylum, genus, and species levels.

