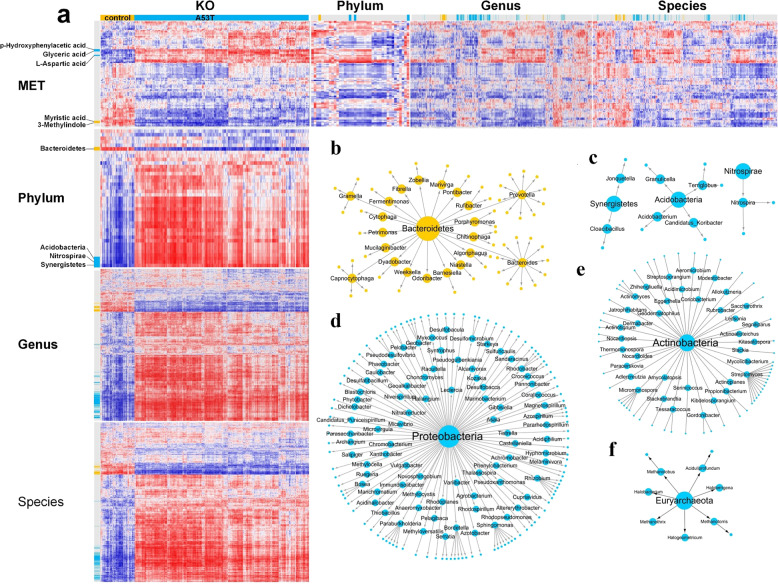
Fig. 3. Integrated analysis of intestinal microbiota and metabolites.
a The yellow/blue labels on the left side of the figure indicate the microbe showing significantly different enrichment in the control/A53T group (p < 0.05). b–g This difference has a distinct transmission relationship in the classification of part microbe (The direction of the phylum-genus-species is indicated by blue/yellow arrows). Yellow present increased in the A53T group. Blue present increased in the control group.

