Figure 2.

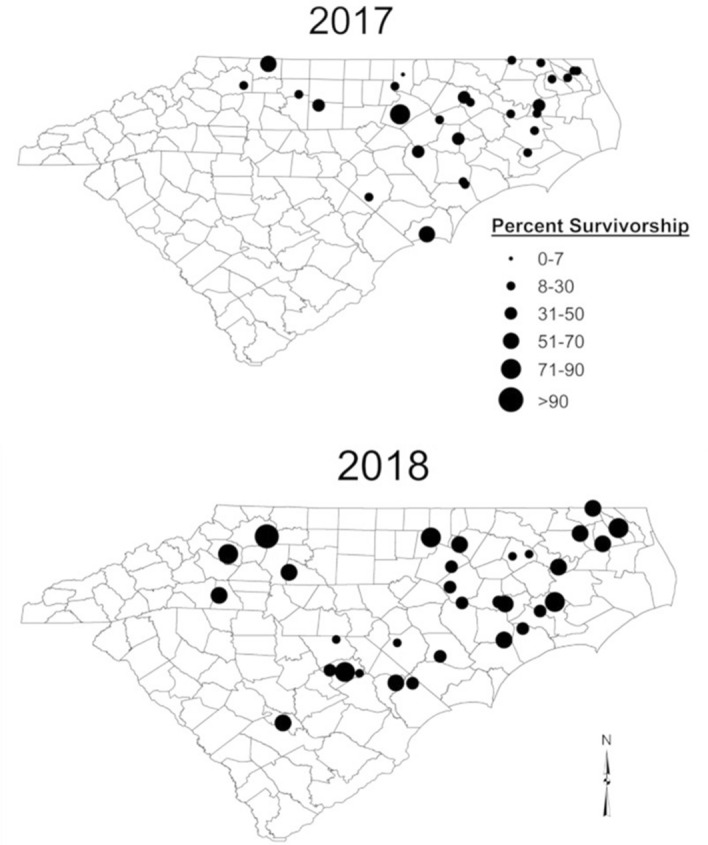
Survivorship of H. zea from different collection sites in 2017 (n = 28) and 2018 (n = 31) following exposure to 29 µg/cm2 Cry1Ac in diet-overlay assay. Each dot represents the collection site and dot size represents percent survivorship.

Survivorship of H. zea from different collection sites in 2017 (n = 28) and 2018 (n = 31) following exposure to 29 µg/cm2 Cry1Ac in diet-overlay assay. Each dot represents the collection site and dot size represents percent survivorship.