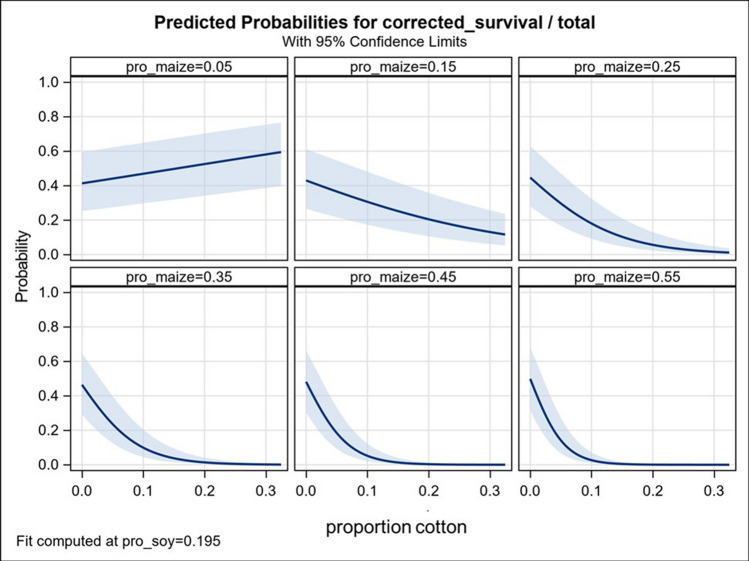
Figure 3.
Predicted survival of H. zea larvae in response to proportional areas of cotton at six levels of proportional abundance of maize during the prior year within a 1-km radius of the collection site. Proportional abundances of maize shown (0.05; 0.15; 0.25; 0.35; 0.45; 0.55). were selected to illustrate changes in response to maize abundance across the range observed in our study (0.01 to 0.54). Data provided in Table S2. Fit is computed at the mean proportional area of soybean (0.195). Shaded bands are 95%CI.

