
Figure 2. Standard graph for Evan’s blue staining.
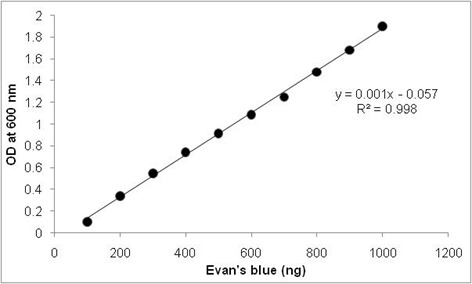
Standard graph is prepared using 1 µg ml-1 of Evan’s blue stock solution. Different concentrations of Evan’s blue were diluted and absorbance was recorded at 600 nm.
Official websites use .gov
A
.gov website belongs to an official
government organization in the United States.
Secure .gov websites use HTTPS
A lock (
) or https:// means you've safely
connected to the .gov website. Share sensitive
information only on official, secure websites.
Standard graph is prepared using 1 µg ml-1 of Evan’s blue stock solution. Different concentrations of Evan’s blue were diluted and absorbance was recorded at 600 nm.