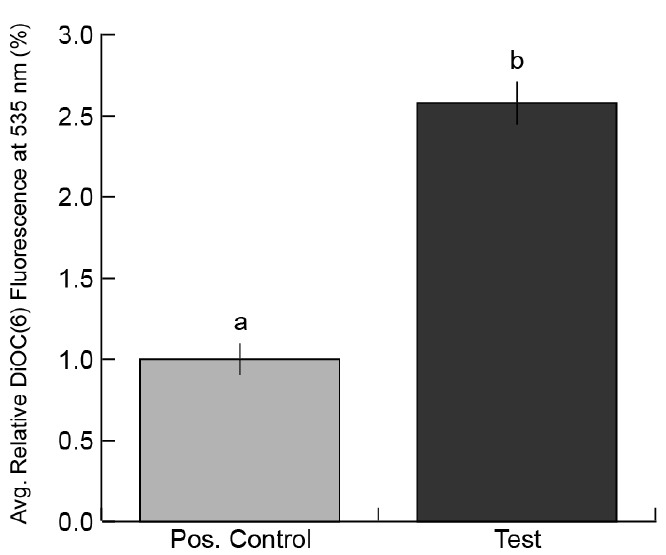
Figure 5. Example graph of DiOC6 fluorescence.

The above graph was generated from a replicate of an experiment presented in Rutter and Innes (2017). The experiment compared EV secretion between mock-treated Arabidopsis thaliana plants (Positive Control) and plants infected with a virulent strain of Pseudomonas syringae (Test).
