
Figure 4. HRM data presented as normalized melting peaks.
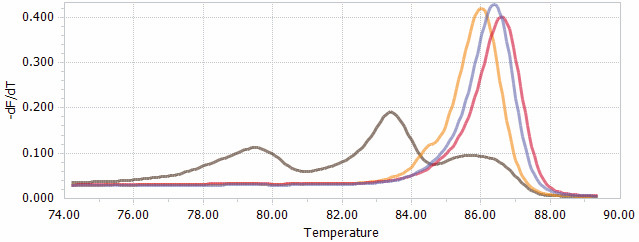
Purple line: profile of a WT PCR product. Red line: profile of a PCR product containing a single biallelic G-insert. Yellow line: profile of a PCR product containing a single biallelic A-insert. Brown line: profile of a mix of PCR products containing a variety of deletions of different sizes.