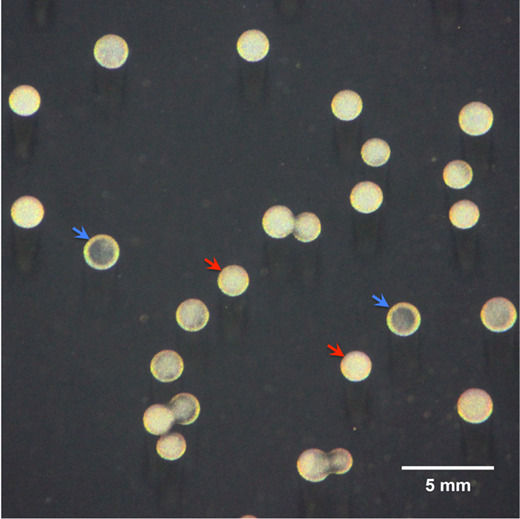
Figure 1. A photograph of the phase variation between opaque and transparent colonies in a clonal population of S. pneumoniae strain ST556.

Colonies were produced on a TSA plate supplemented with catalase after 16-h incubation and observed under a dissection microscope as described above. The representative opaque and transparent colonies are indicated by red and blue arrowheads, respectively. The scale bar was shown at the bottom right of this image ( Li et al., 2016 ).
