FIGURE 3.

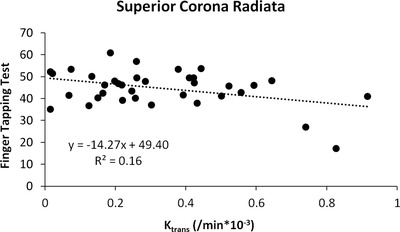
Scatterplot demonstrating inverse relationship between median K trans values in the superior corona radiata and performance on the finger‐tapping test. Pearson's correlation of −0.426 and 2‐tailed p = .015

Scatterplot demonstrating inverse relationship between median K trans values in the superior corona radiata and performance on the finger‐tapping test. Pearson's correlation of −0.426 and 2‐tailed p = .015