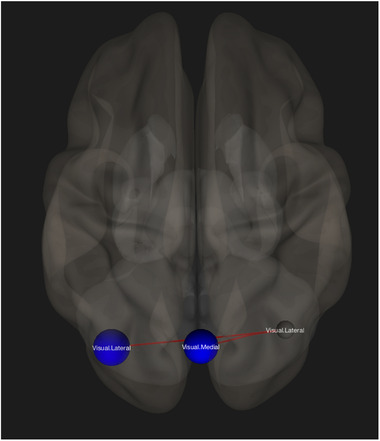
FIGURE 2.

Region‐of‐interest (ROI)‐to‐ROI contrast showing decreased functional connectivity (blue) for the mild traumatic brain injury (mTBI) group as compared to healthy controls, after controlling for the effect of injury history. The graphic is displayed in superior view with ROI‐to‐ROI connection threshold set at p‐ false discovery rate (FDR) corrected < 0.05
