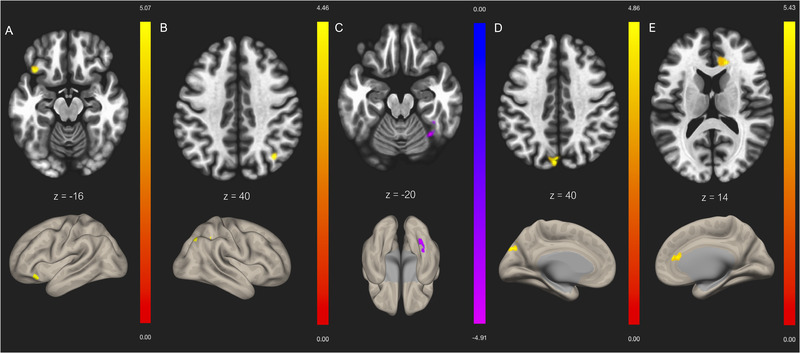
FIGURE 3.

Independent component analyses (ICA) contrast between mild traumatic brain injury (mTBI) > healthy controls functional connectivity for (A) sensorimotor network with frontal orbital cortex (L), (B) visual network with lateral occipital cortex (R), (C) visual network with temporal occipital fusiform cortex (R), (D) default mode network (DMN) with cuneal cortex (L), (E) dorsal attentional network with cingulate gyrus. Slices denote the peak activation coordinates, whereas the color bar represents positive t‐values in yellow/red and negative t‐values in blue/purple. Slices are displayed at uncorrected threshold p < .001, and false discovery rate (FDR)‐corrected cluster threshold p < .0
