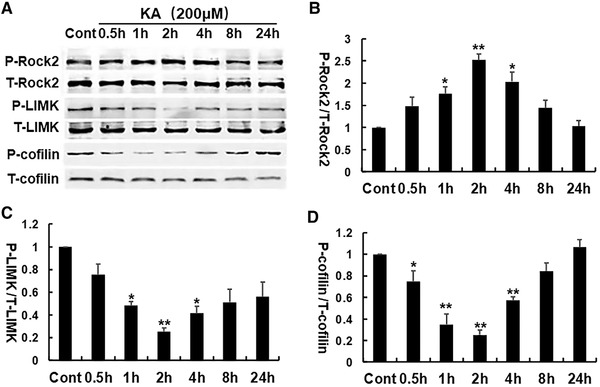
FIGURE 2.

The time course of KA‐induced activation of the RhoA/Rho kinase pathway. (A) Representative Western blots of P‐ROCK2 T‐ROCK2, P‐LIMK, T‐LIMK, P‐cofilin, and T‐cofilin expression. (B–D) The relative expression of phosphorylated proteins was calculated for each condition and normalized to the control. *p < .05, **p < .01 by one‐way ANOVA compared to control group (n = 5)
