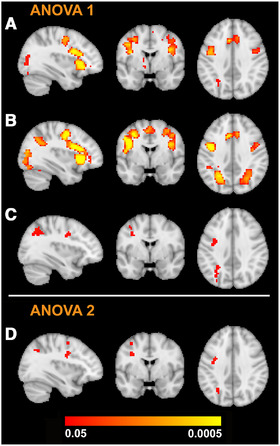
FIGURE 1.

Sagittal, coronal and axial slices showing the average activation across all participants at (A) scan 1 and (B) scan 2 to negative (angry, fearful, sad) > happy facial expressions. Regions activated at both scans include the insula, inferior frontal gyrus, paracingulate gyrus, and lateral occipital cortex. Increased activation in the parietal lobules is evident at scan 2. (C) The F‐test for the group x scan interaction for analysis of variance (ANOVA) 1 resulted in activation in the left parietal lobule, angular gyrus, precentral gyrus, and inferior frontal gyrus. (D) The group x scan interaction for ANOVA 2 showed peak activation in precentral, midfrontal and lateral occipital regions. In MNI coordinates, all images are shown at level of x = −34 (sagittal), y = −1 (coronal), z = 36 (axial). Color bar indicates threshold‐free cluster enhancement family‐wise error‐corrected P‐values
