
FIGURE 2.
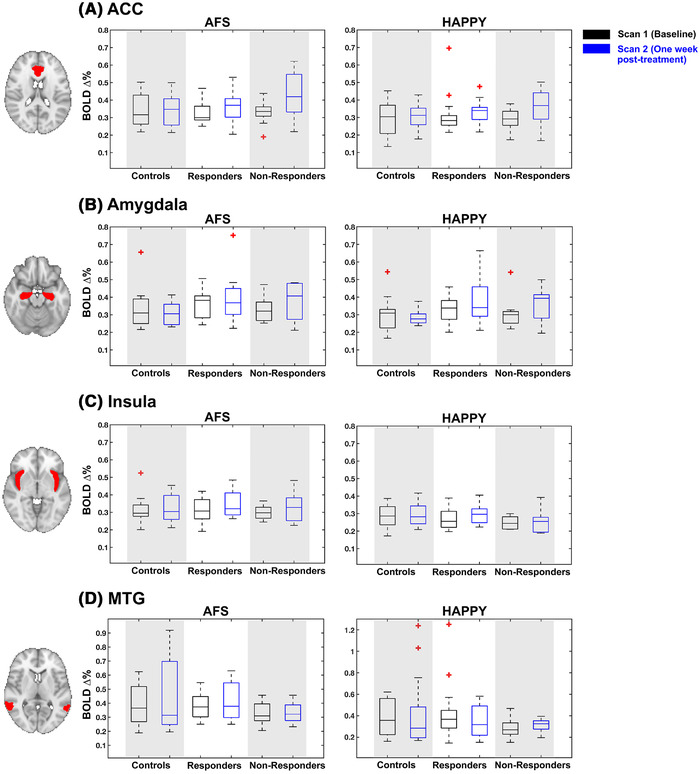
Boxplots showing blood oxygenation level‐dependent percent signal changes (PSC) for each group (controls, responders, non‐responders) within each of the four regions‐of‐interests (ROIs). The PSC to the angry, fearful, sad (AFS) faces shown in figures in the left column, and happy faces are shown in figures on the right. Both scans are shown, with scan 1 (baseline) in black boxes and scan 2 (one‐week post‐treatment) in blue. Red asterixis indicate outliers. The axial anatomical figures show on the left highlight the ROI in red, overlaid onto the MNI template image. Each row indicates the ROI: (A) Anterior cingulate cortex (ACC), (B) amygdala, (C) insula, and (C) mid temporal gyrus (MTG)