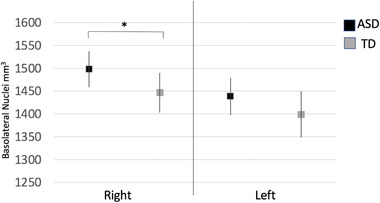
FIGURE 2.

Volumes of left and right BLA nuclei (cubic millimeters [mm3], y axis) from both time points examined in relation to diagnosis (ASD—black; TD—grey). Values represent the estimated marginal means of the volumes of the BLA, adjusting for site, scan, sex, age, IQ, and total cerebral volumes based on the output from the generalized estimating equation model. The right BLA subnuclei were significantly larger in adolescents with ASD (p = 0.02). *<0.05
