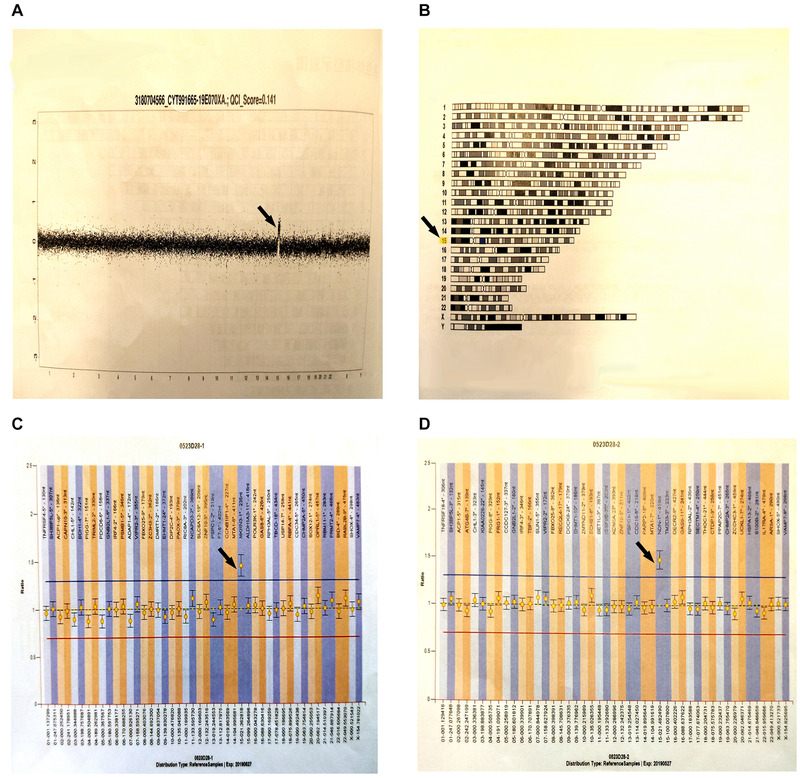
FIGURE 2.

Gene test results. (A) A whole chromosome diagram: This diagram is the result of analysis. The transverse axis represents chromosomes 1–22 and sex chromosomes, and the longitudinal axis represents the signal ratio of tested sample to reference chromosome (expressed in log2ratio). The length of black segment and values represent the size of each segment and the mean of signals. (B) Chromosome karyotype diagram: The missing (loss) or amplified (gain) regions of analysis results are marked on the relative position of chromosomes. Deletion will be marked in red blocks and amplification in blue blocks. (C) After detecting MLPA P036, the exon1 repeat variation of MKRN3 is found at the 15q‐cen site in the subject. (The detection of subtelomeres involve two kits, namely P070 and P036. Test results need to be combined with other findings. Only if the exon on the same chromosome of the two probes mutates, the correct conclusion will be obtained.) (D) After detecting MLPA070, the exon1 repeat variation of NDN is found at the 15q‐cen site in the subject. (The results of both c and d indicate that the results of chromosome 15 are abnormal. Generally, the rearrangement of subtelomeres is existed in this site.)
