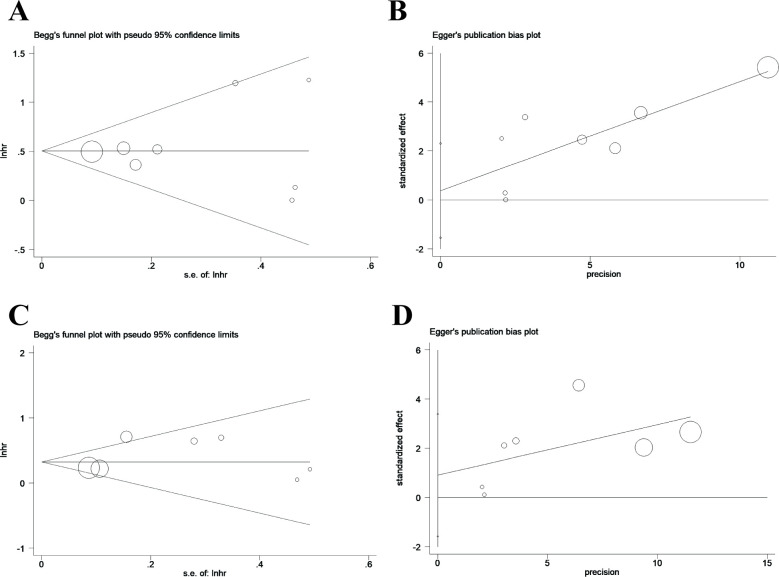
Figure 4.
Funnel plot for analysis of publication bias. (A) Funnel plot established using Begg’s test for studies with overall survival (OS); (B) funnel plot using Egger’s test for studies with OS. (C) Funnel plot established utilising Begg’s test for studies with progression-free survival (PFS); (D) funnel plot using Egger’s test for studies with PFS.

