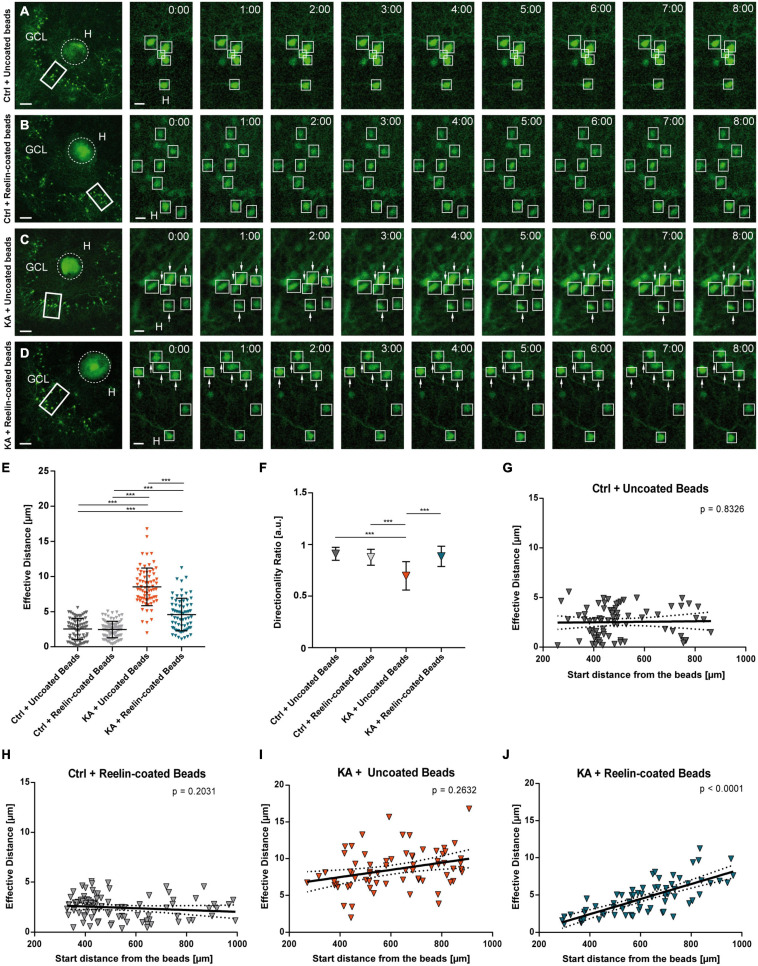
FIGURE 4.
Placement of Reelin-coated beads into the hilus stops KA-induced migration. Live cell imaging of individual eGFP-positive GCs was performed over a period of 8 h, and migration distances of automatically selected neurons were assessed. Cell motility was determined by calculating both the total length of the traveled path over 8 h and the effective migration distance as the length of the resulting vector between start (t = 0 h) and end point (t = 8 h). The border between the beads and GCL was marked and the distance was calculated between the start and end point of the cells to this border. (A–D) Representative confocal micrographs of nine imaging time points are shown for each condition. Left panel: overview; white frame indicates the area shown at high magnification on the right. Tracked cells are marked by white frames and GCs with high motility are indicated by arrows. OHSC were treated with 10 μM KA for 45 min, followed by placement of beads. Uncoated fluorescent beads (A,C) or Reelin-coated (B,D) were positioned into the hilus. Each slice derived from a different animal (A) Control + uncoated beads (n = 6 slices, 77 cells). (B) Control + Reelin-coated beads (n = 7 slices, 89 cells). (C) KA + uncoated beads (n = 4 slices, 70 cells). (D) KA + Reelin-coated beads (n = 5 slices, 68 cells). (E) Quantitative evaluation of migration distances of individual GCs. Under control conditions with uncoated and with Reelin-coated beads, GCs do not change position. KA induces migration of GCs but this is strongly reduced by placement of Reelin-coated beads. (F) Diagram showing the directionality ratios of the different groups. Note that GCs of the KA + uncoated bead group have lower values than the two control groups. GCs of KA-treated OHSC with Reelin-coated beads present a ratio similar to controls. (G–J) Quantitative evaluation of migration distances of individual GCs in relation to their start distance from the beads. (G) Control + uncoated beads, (H) Control + Reelin-coated beads, (I) KA + uncoated beads. Note that in these group there is no correlation between effective migration distance and start distance from the beads of tracked GCs. (J) KA + Reelin-coated beads. A positive correlation (Pearson correlation coefficient r = 0.7461) between the initial position and the migration behavior of the eGFP-positive cells is apparent. One-way ANOVA followed by Tukey’s Multiple Comparison Test (***P < 0.001). GCL, granule cell layer; H, hilus. Scale bars: 80 μm for overview; 10 μm for high magnifications.

