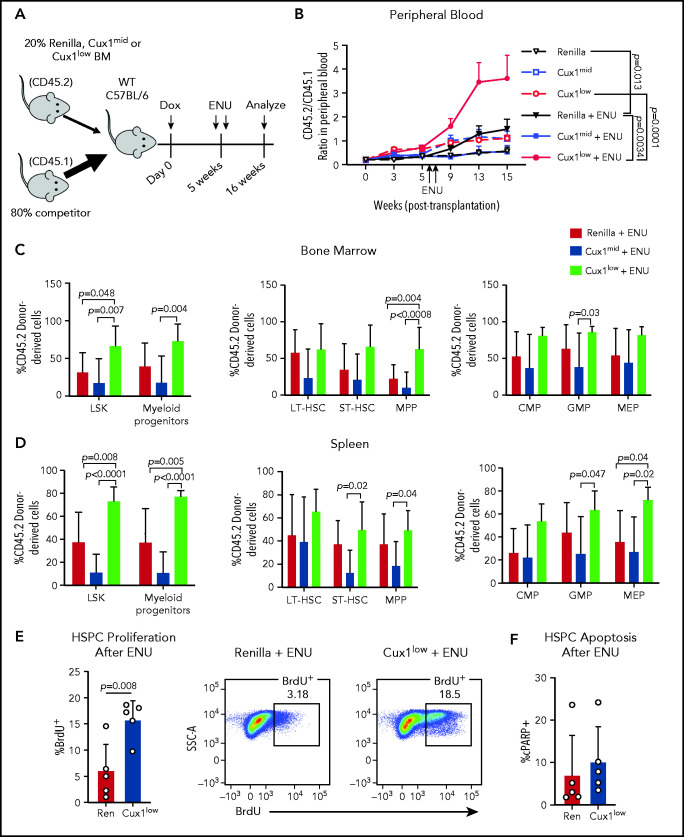
Figure 5.
Cux1low cells aberrantly proliferate and expand following DNA-damaging alkylating agents. (A) Bone marrow from Ren, Cux1mid, and Cux1low mice was transplanted at a 1:4 ratio with competitor bone marrow, and recipients were treated continuously with Dox beginning the day of transplant. Two doses of ENU (100 mg/kg) were administered 9 days apart, starting 5 weeks after transplant. (B) The contributions of Ren (n = 9), Cux1mid (n = 8), and Cux1low (n = 9) cells to the peripheral blood were monitored by flow cytometry. The ratio of Ren, Cux1mid, or Cux1low cells (CD45.2) to competitor cells (CD45.1) is shown. The mean ± SEM is shown. A mixed-effects analysis with the Geisser-Greenhouse correction is shown. Two independent biological replicates were performed (n = 4-5 mice per replicate per genotype). (C-D) At 16 weeks, the mice were euthanized and the contributions of Ren, Cux1mid, and Cux1low (CD45.2) to the hematopoietic stem and progenitor populations were measured by flow cytometry in the bone marrow (C) and spleen (D). LSK cells and myeloid progenitors (Lin−/Sca1−/c-Kit+) are shown (left). LSK cells were further gated for long-term HSCs (LT-HSC; CD150+/CD48−), short-term HSCs (ST-HSC; CD48−/CD150−), and multipotent progenitors (MPP; CD48+/CD150−) (center). Within the progenitor population, cells were separated into common myeloid progenitors (CMP; CD34+/CD16/32low), granulocyte-monocyte progenitor (GMP; CD34+/CD16/32high), and megakaryocyte-erythroid progenitors (MEP; CD34−/CD16/32−) (right). The mean ± SD and P values from a 1-way ANOVA comparison are shown. Two independent biological replicates were performed. (E) Proliferation was measured in Ren and Cux1low mice after ENU administration. Mice were given 2 doses of ENU, 9 days apart. Six hours after the second dose of ENU, BrdU was administered. BrdU+ cells were measured by flow cytometry 12 hours after BrdU injection in the bone marrow HPSC population (Lin−). Representative flow plots are shown. The mean ± SD and Student t test P value is shown. (F) Apoptosis was measured in the same cells by flow cytometry using antibodies for cleaved poly (ADP-ribose) polymerase (cPARP). Three independent biological replicates were performed. SSC-A, side scatter area; WT, wild type.

