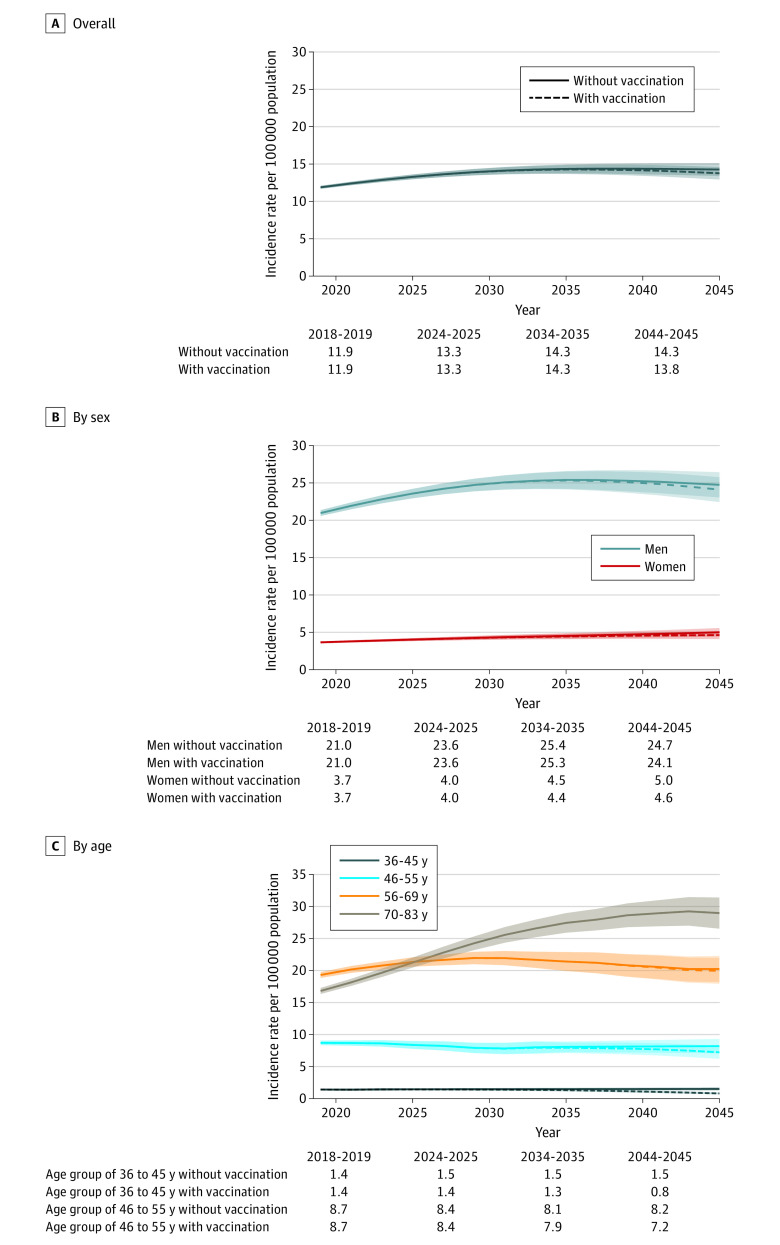
Figure 2. Projected Age-Standardized Oropharynx Cancer Incidence Rates per 100 000 Population Overall, by Sex, and by Age Group Under Current Human Papillomavirus (HPV) Vaccination Rates Compared With the Scenario of Expected Incidence With No Vaccination for 2018 to 2045.
Solid lines represent the projected age-standardized oropharynx cancer incidence rates in the scenario of no vaccination. Dashed lines represent the projected age-standardized oropharynx incidence rates under current HPV vaccination rates. Shaded areas represent the 95% CIs for the estimates of oropharynx cancer incidence rates.

