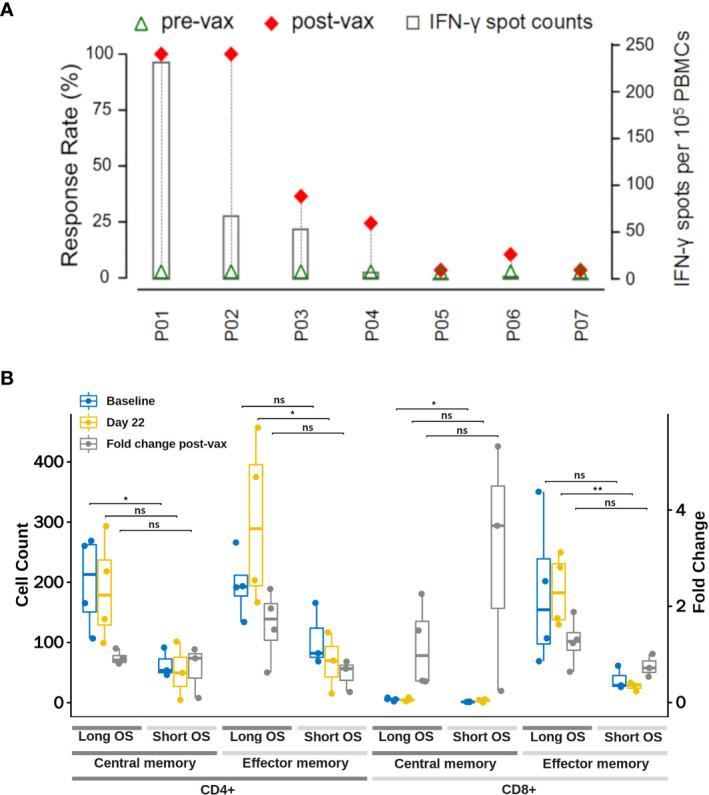
Figure 4.

Immune Response induced by iNeo-Vac-P01. (A) iNeo-Vac-P01 induced specific T cell response. For each patient marked in X-axis, green triangle and red diamond represent the response rates pre- and post-vaccination, defined as the ratios of the numbers of peptides (or peptide pools) with positive ELISpot results before and after vaccination to the total number of peptides (or peptide pools) in vaccine, respectively. The bar chart with secondary Y-axis represented the IFN-γ spots per 105 PBMCs of the peptide with best response for each patient. (B) Change in T cell subsets count at baseline and 22 days post iNeo-Vac-P01 vaccination. Blue and yellow dots represent the cell counts at baseline and 22 days post iNeo-Vac-P01, respectively. Grey dots represent the fold change of corresponding cell count, which can be read at the right Y-axis. Counts of T cell subsets including CD4+ central memory, CD4+ effector memory, CD8+ central memory and CD8+ effector memory T cells were compared in long OS patients (shown in dark grey) and short OS patients (shown in light grey). *: significant, p=0.01 to 0.05; **: very significant, p=0.001 to 0.01; ns: not significant.
