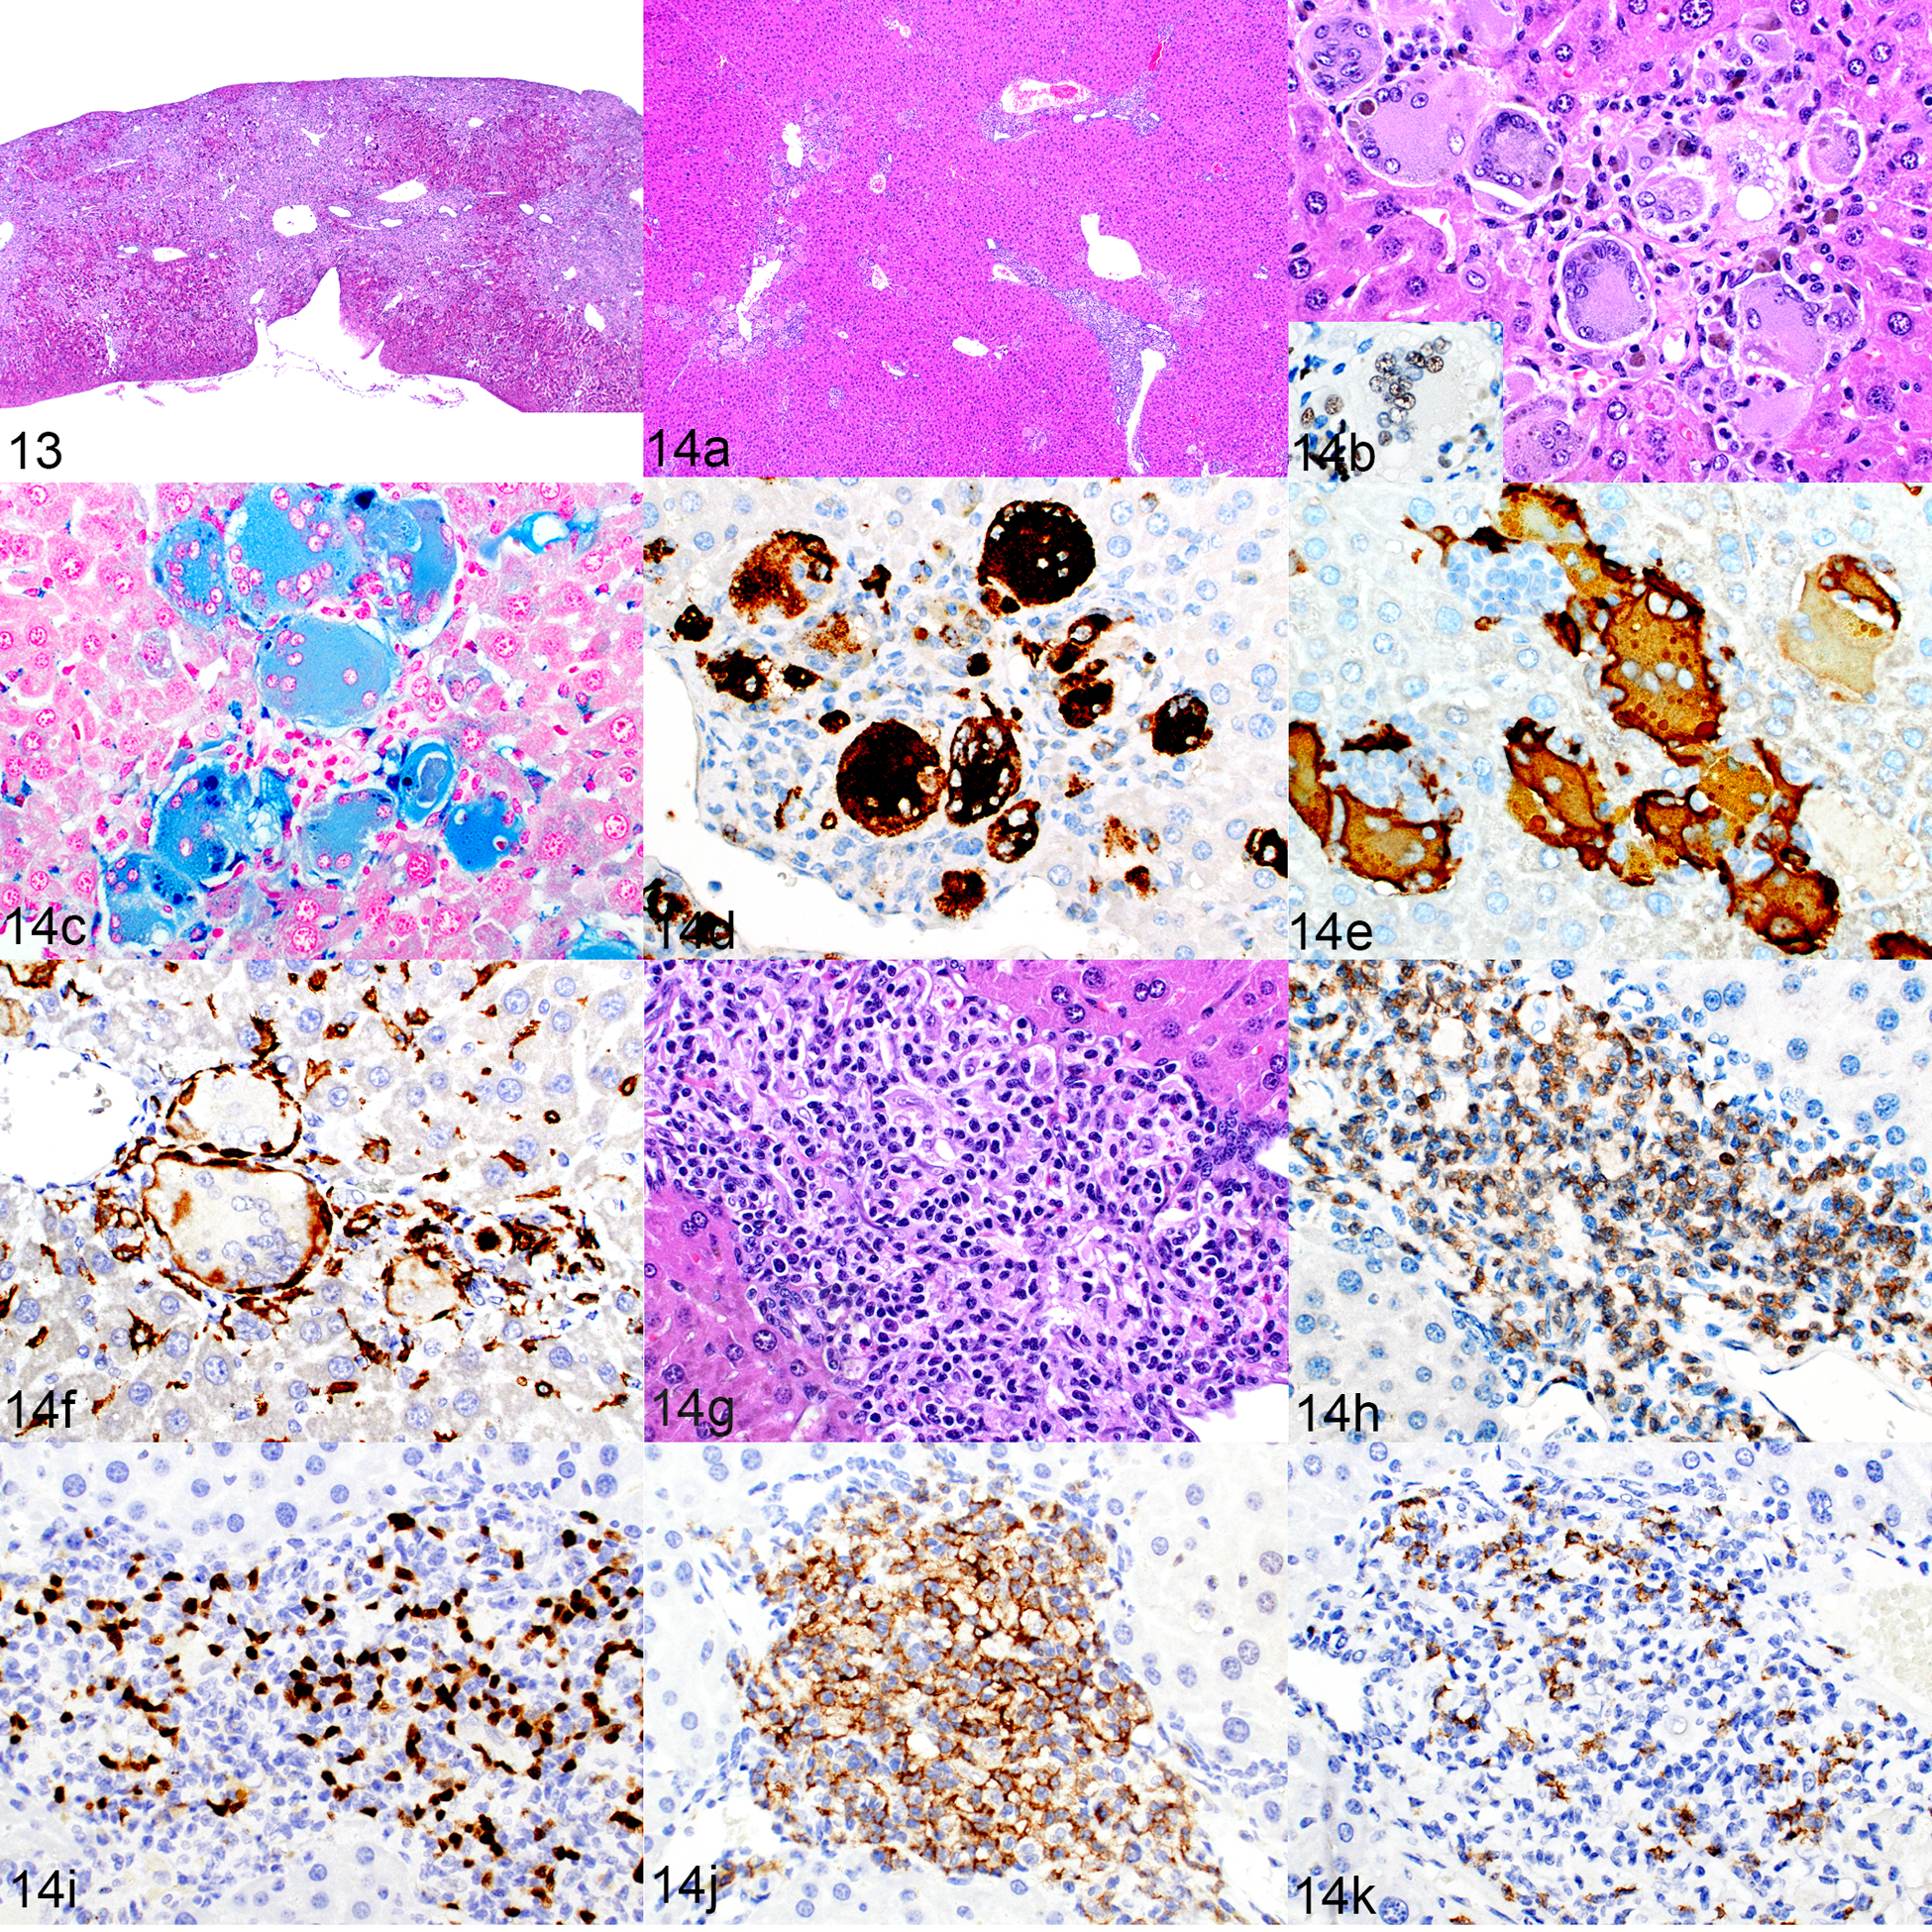
Figures 13 and 14.

Macrophage and lymphocyte infiltrates, liver, humanized NSG-SGM3 mice. Figure 13. Mouse no. 13. Severe macrophage and lymphocyte infiltration with replacement of the liver parenchyma and grossly visible compaction. HE. Figure 14. Mouse no. 2. Morphologic and immunophenotypic characterization of liver infiltrates representative of typical moderate severity. (a) Mild to moderate portal, perivascular and sinusoidal infiltrates. Same magnification as Fig. 13. HE. Figures 14 b–f show higher magnification of the macrophage area in Fig 14a, and Figs 14 g–k show the lymphoid area. (b) The cells are predominantly large multinucleated giant cells with intracytoplasmic pigment. HE. Inset: the cells are hNuMA1-positive. (c–e) The cytoplasm of these macrophages stains positively for iron with Prussian Blue (c) and is immunolabeled for hCD68 (d) and hCD163 (e). (f) Individual large multinucleated giant cells are surrounded by cells that are immunolabeled for mouse F4/80. (g) A portal area of liver infiltrated by lymphocytes. HE. (h–k) The lymphoid population contains slightly more CD3-positive T cells (h) than PAX5-positive B cells (i). The T-cell population is predominately CD4-positive (j) but includes low numbers of CD8-positive cells (k).
