Figures 26 and 27.

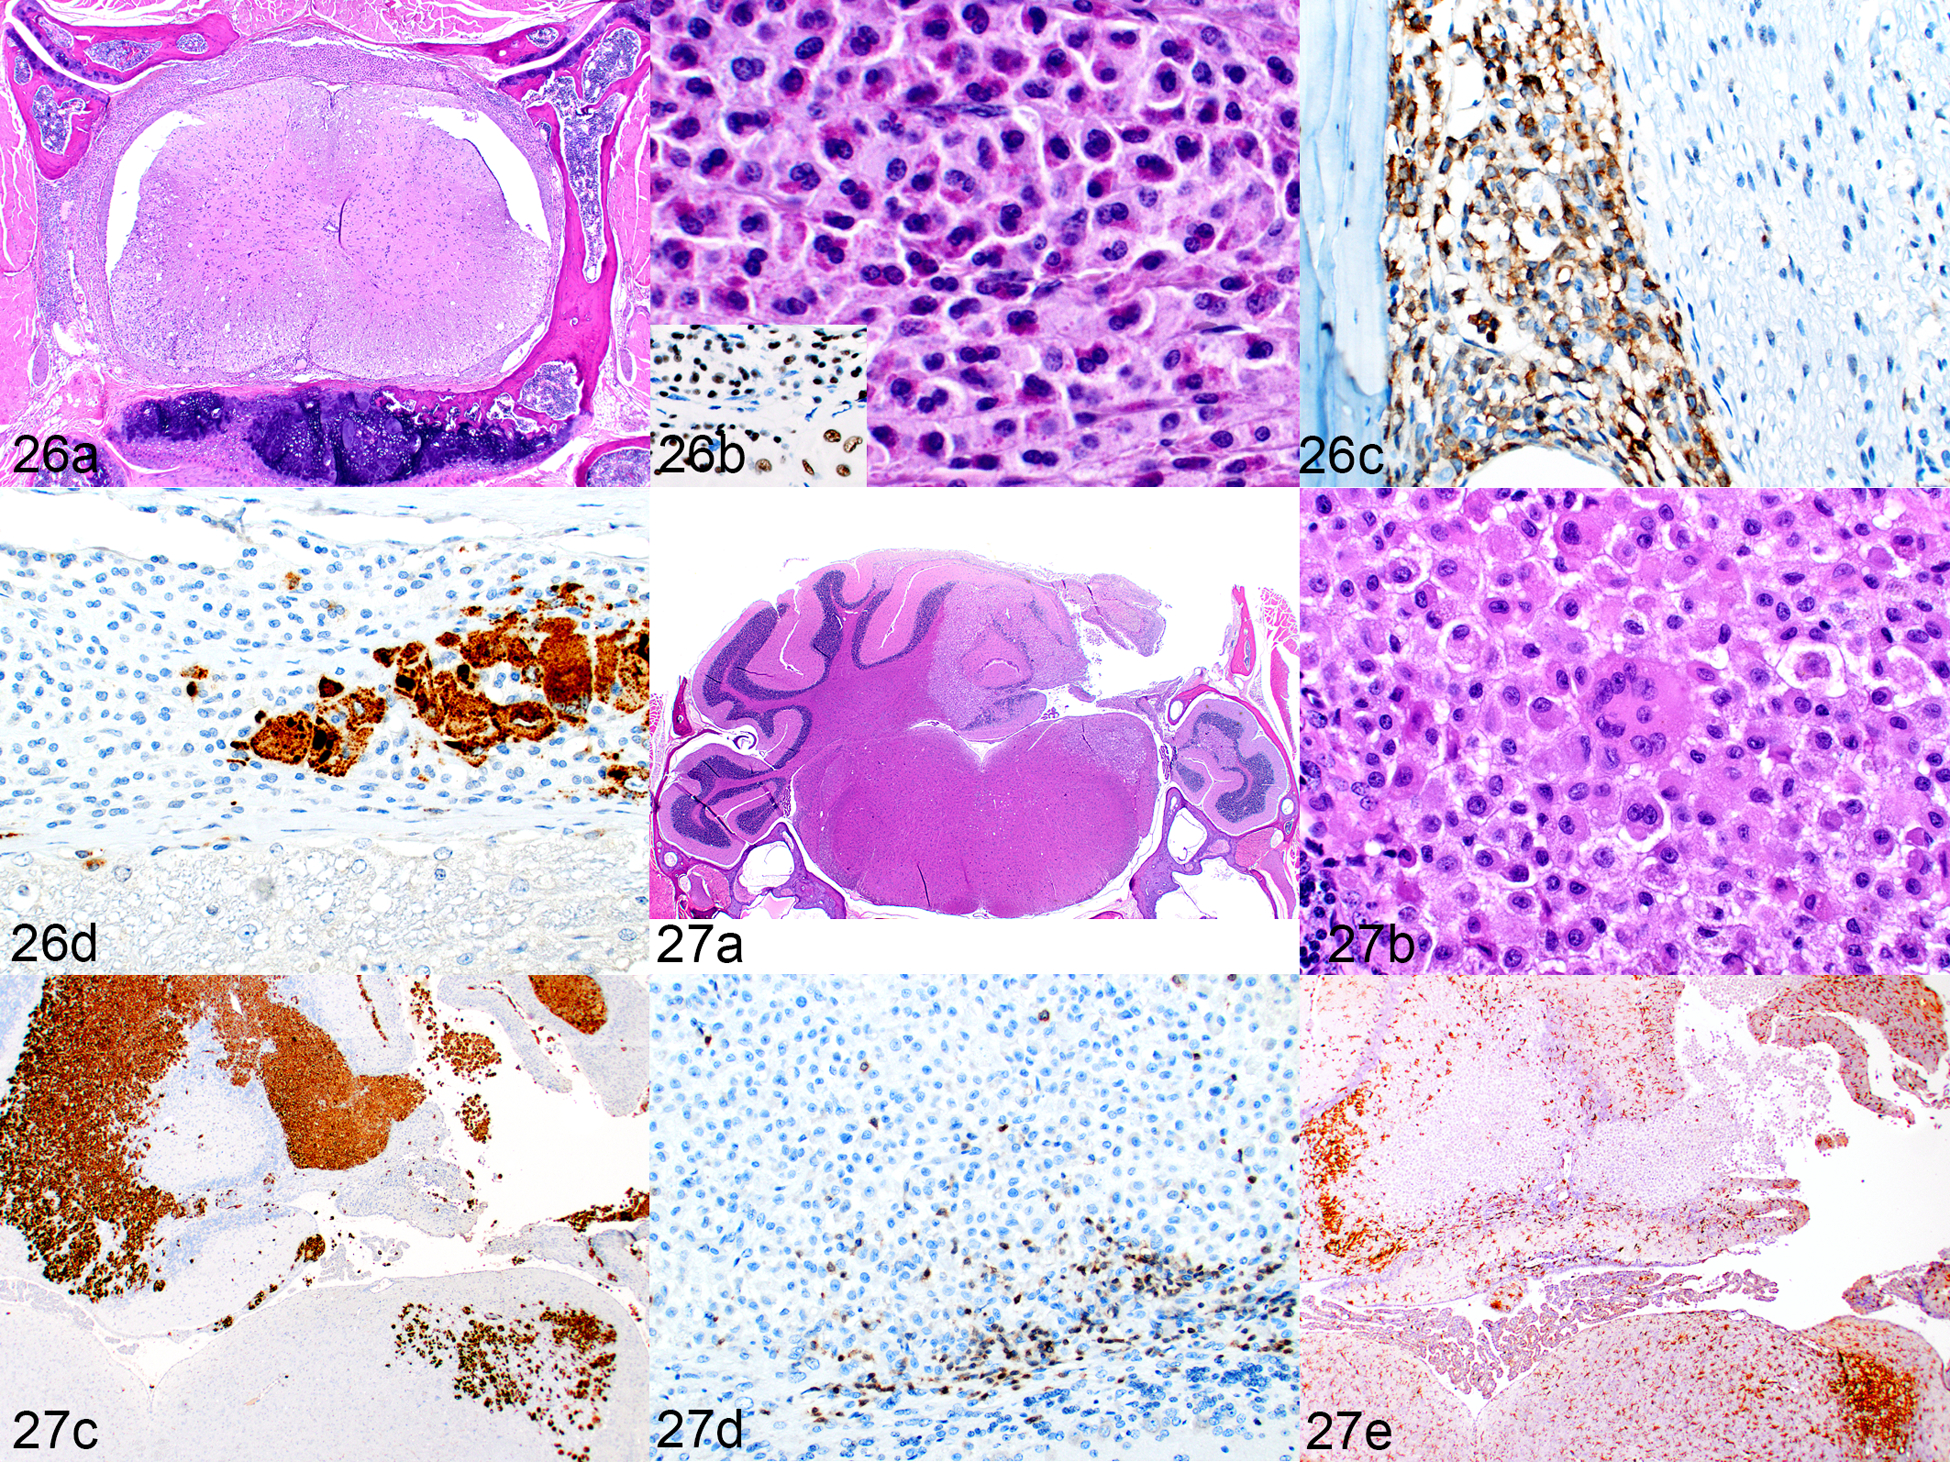
Inflammatory cell infiltration of the CNS, humanized SGM-SGM3 mice. Figure 26. Spinal cord (mouse no. 2). (a) Vertebra and spinal cord cross-section. The meninges are thickened by mixed, patchy infiltrates of immune cells. HE. (b) One area shows prominent eosinophils. HE. Inset: immunolabeling for hNuMA1. (c) In other areas, the infiltrate is more lymphocytic, predominantly consisting of CD3-positive T cells. (d) Multiple foci of hCD68-positive macrophages are scattered in the meninges. Figure 27. Cerebellum, mouse no. 9. (a) Marked infiltration of macrophages in the right dorsal quadrant. HE. (b) The infiltrating cells are moderate to large in size, and there are occasional multinucleated giant cells. However, there is no cytoplasmic pigment as seen in cells in the spleen and liver. HE. (c) There is extensive infiltration of the cerebellum by hCD68-labeled cells. (d) Small numbers of CD3-positive T cells are present and only at the periphery of the lesion. (e) Reactive, proliferating cells that are immunolabeled for mouse F4/80- are present in the brain parenchyma bordering the macrophage infiltration.
