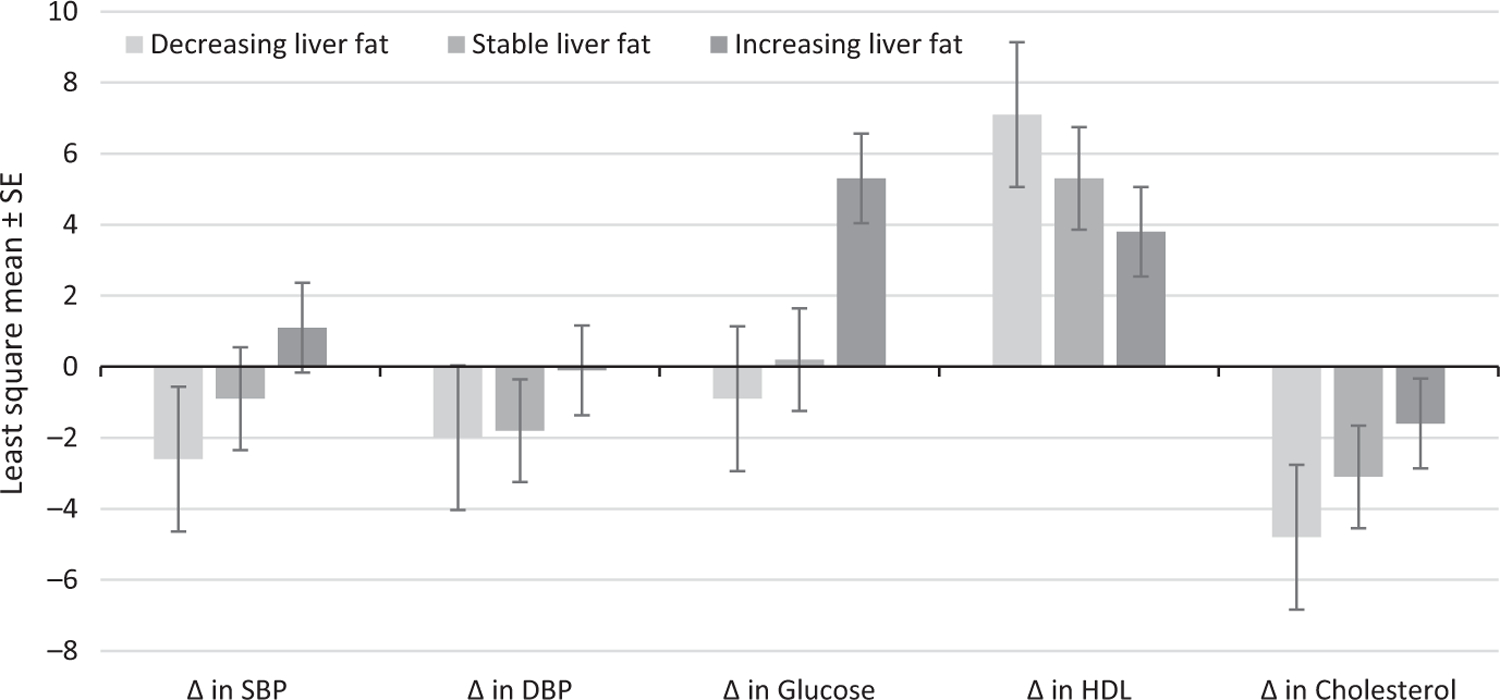
FIGURE 1.

Multivariable-adjusted least-square means of the change in cardiovascular disease risk factors by categories of liver fat change. The categories of liver fat change were defined as decreasing liver fat (bottom quartile of liver phantom ratio change; n = 202), stable liver fat (middle two quartiles of liver phantom ratio change; n = 404), and increasing liver fat (top quartile of liver phantom ratio change; n = 202). P values are for the test for trend. Models were adjusted for baseline age, sex, baseline smoking status, baseline drinks per week, baseline liver phantom ratio, baseline outcome variables and treatment variables at baseline and follow-up
