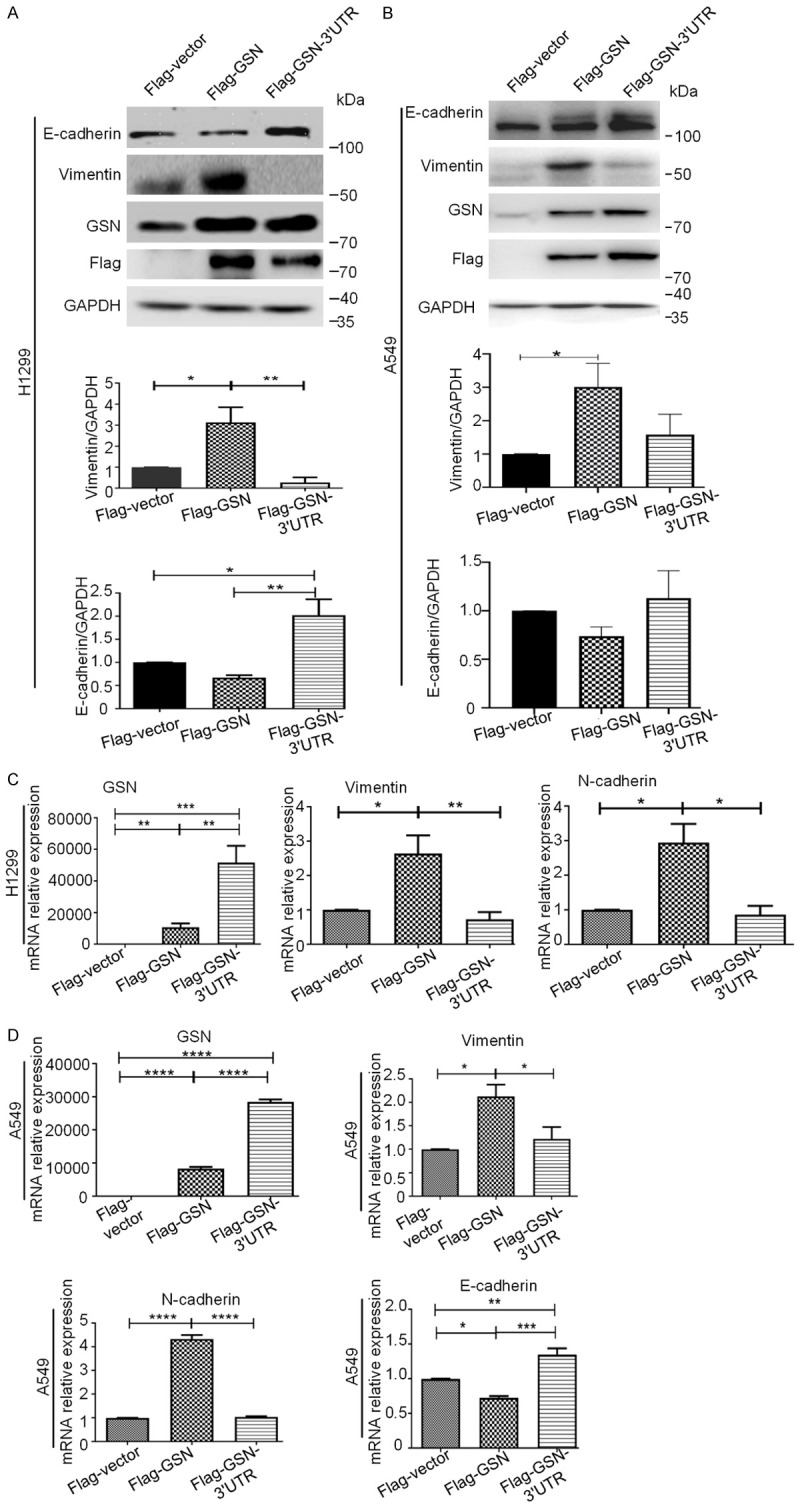
Figure 2.

GSN or GSN 3’UTR exerted opposite effects on EMT process in H1299 and A549 cells. Protein expression of E-cadherin, Vimentin and transfected Flag-GSN expression by Western blotting in H1299 (A) and A549 (B) cells after transfected with the indicated plasmids. Signal intensities were quantified with GAPDH as internal control. (C, D) The mRNA levels of EMT marker and GSN were shown by qRT-PCR after transfected with the indicated plasmids in H1299 (C) and A549 (D) cells. Data are presented as the mean ± s.d. and are representative of at least three independent experiments. *P < 0.05, **P < 0.01, ***P < 0.001.
