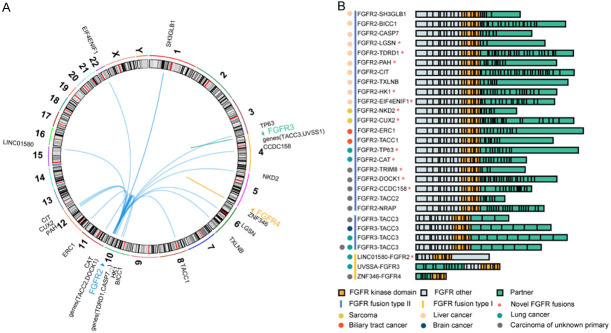
Figure 6.
Distribution of the genes fusing with FGFR1-4 in all cancer cases. A: The Circos plot graphically depicts FGFR and their fusion partners, showing specific chromosomal locations of fusion partners. B: Schematic of all FGFR fusion proteins identified, at scale with exons represented by individual boxes. The upstream partner is colored grey, with FGFR kinase domain colored orange and other FGFR exons colored green.

