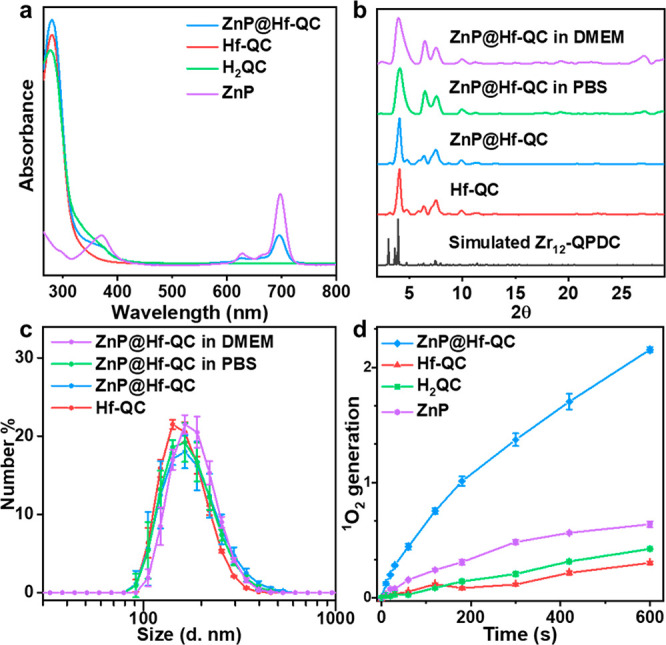
Figure 3.

(a) UV–vis spectra of ZnP, H2QC, Hf-QC, and ZnP@Hf-QC in DMSO. (b) PXRD patterns of Hf-QC, ZnP@Hf-QC (as synthesized and after soaking in PBS or DMEM for 24 h), and the simulated pattern for Zr12-QPDC. (c) Number-averaged diameters of Hf-QC and ZnP@Hf-QC (as synthesized and after soaking in PBS or DMEM for 24 h) in ethanol. (d) 1O2 generation of ZnP, H2QC, Hf-QC, and ZnP@Hf-QC detected by SOSG assay (n = 3).
