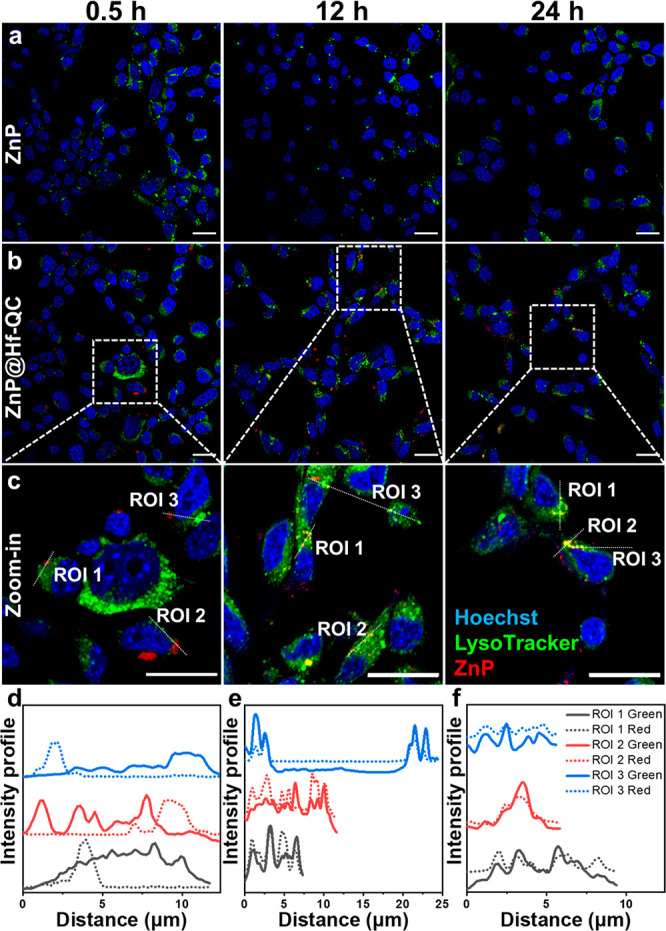
Figure 4.

CLSM images showing colocalization of ZnP (a) and ZnP@Hf-QC (b, c) with endo/lysosomes after incubation with CT26 cells for 0.5, 12, and 24 h (yellow = green + red, scale bars are 20 μm). (d–f) Colocalization analysis between endo/lysosomes (green) and ZnP (red) in different ROIs (white dashed lines in Figure 4c).
