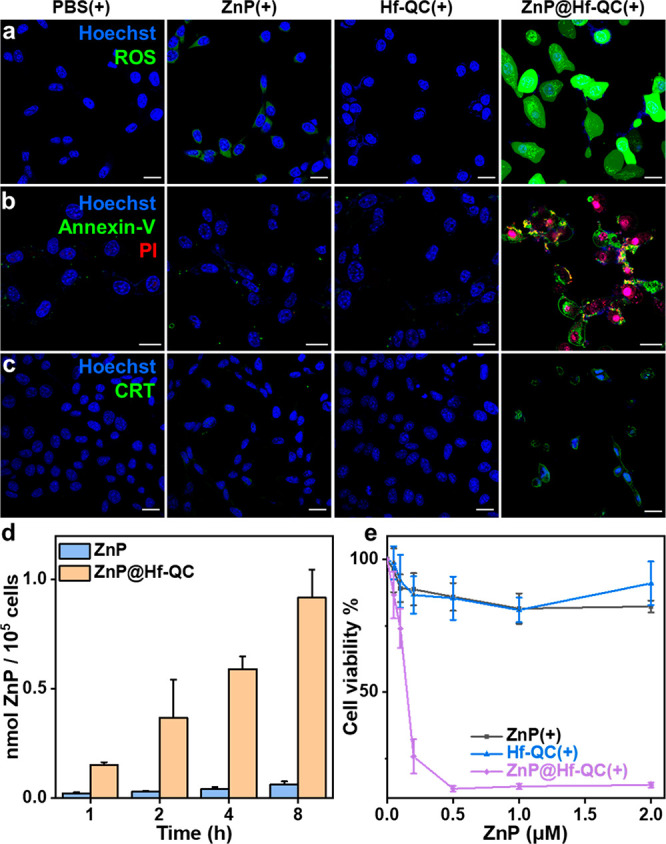
Figure 5.

(a) Total ROS generation by DCF-DA assay (green). (b) Cell apoptosis stained by Alexa Fluor 488 Annexin V (green) and PI (red) (pink = red + blue). (c) CRT translocation stained by Alexa Fluor 488 CRT antibody (green) (d) Cellular uptake measured by UV–vis spectroscopy, n = 3. (e) Viability of cells treated with ZnP(+), Hf-QC(+), and ZnP@Hf-QC(+) by MTS assay. Cell nuclei were stained by Hoechst 33342 (blue) in (a-c). CT26 cells were used for all in vitro experiments and a total light dose of 60 J/cm2 was given. All scale bars equal 20 μm.
