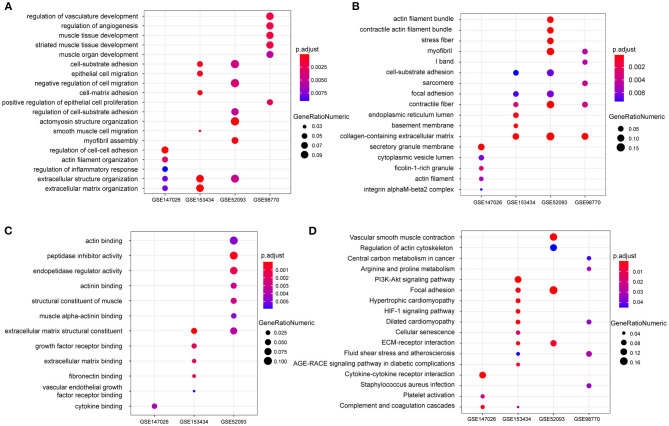
Figure 1.
The enrichment analysis shows the differentially expressed genes between the AD and normal groups. (A–C) GO analysis showing the differences of mRNA expression in the aorta between AD and normal groups on biological processes (A) cellular component (B) or molecular function (C) among the four GEO datasets GSE147026, GSE153434, GSE52093, and GSE98770. (D) KEGG enrichment analysis showing the dramatically altered pathways in AD among the indicated datasets.

