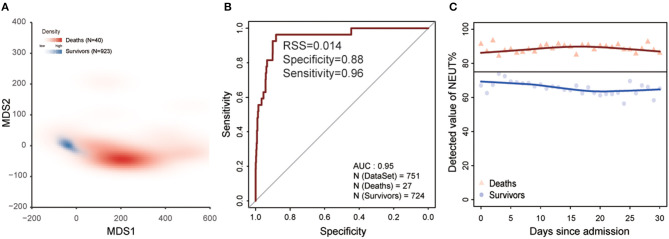
Figure 4.
Laboratory findings to predict the clinical outcome of COVID-19 within the 1st week after admission. (A) MDS plot for distinguishing deaths from survivors based on 13 laboratory findings in training dataset. Red represents deaths and blue represents survivors. (B) The ability of the model for distinguishing deaths from survivors based on 13 laboratory findings in the test dataset. The x-axis is specificity and the y-axis represents sensitivity. (C) The change in the percentage of neutrophils since admission. The black line is the maximum reference value. The blue dot represents survivors and red represents deaths.

