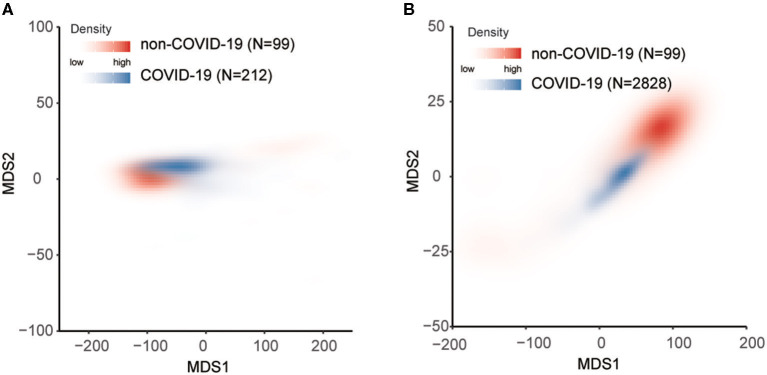
Figure 5.
MDS plot for distinguishing non-COVID-19 from COVID-19 based on laboratory findings. Red represents non-COVID-19 and blue represents COVID-19. The depth of the color represents the density. (A) The difference between FPHJ-548 and nCVP-118 dataset. (B) The difference between nCVP-118 and the HSSH-3015 dataset.

