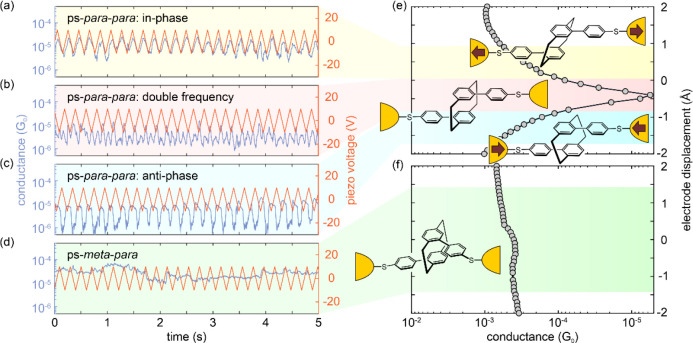
Figure 3.
(a–c) Conductance traces of modulation experiments with ps-para-para-PCP (1), displaying (a) in-phase, (b) double frequency, and (c) anti-phase modulations. (d) Conductance traces of the modulation experiments with ps-meta-para-PCP (2). The red line in the distance–modulation traces represents the voltage applied to the piezoelectric stack, whereas blue represents the measured conductance. The total modulation time of the experiments is 15 s; for better visibility, only 5 s are displayed. (e) Calculated conductance of the ps-para-para-PCP molecular junction during the gap opening. The conductance displacement data is extracted from Figure 5b by evaluating the transmission function at the Fermi energy. The sketches rationalize the variety of conductance vs electrode displacement modulation behaviors observed for ps-para-para-PCP in dependence of the position of the DQI dip with respect to the trapping state of the molecule in the individual junction; see panels a–c and e. In particular, light background colors (yellow, red, and blue) relate the different situations of junctions, including molecules in prestretched, relaxed, or precompressed states, respectively, to the behavior in modulation experiments. (f) Same plot as in panel e but for ps-meta-para-PCP, where mechanosensitivity is basically absent. The green background color connects the conductance that is rather insensitive to electrode displacements to the observations made in the modulation measurements in panel d.

