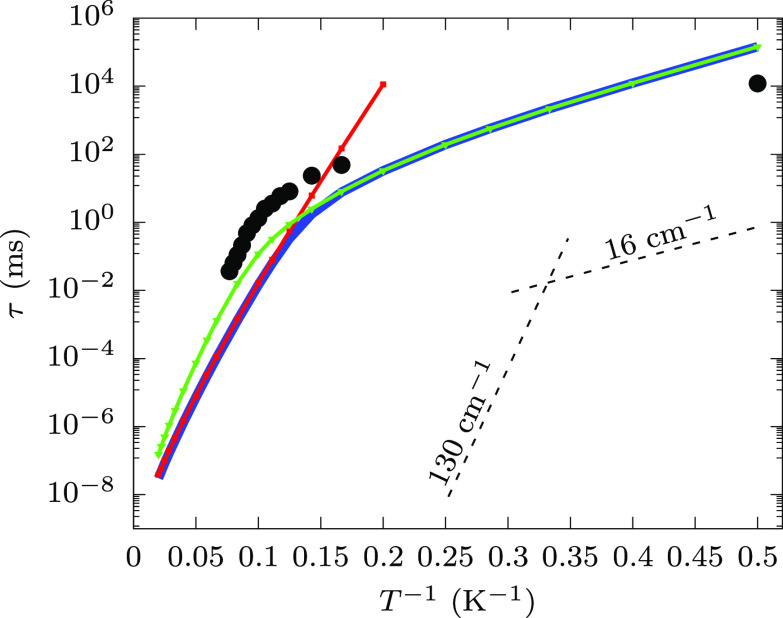
Figure 3.
Temperature dependence of the spin-phonon relaxation time. The continuous blue line reports the total computed relaxation time coming from both the Orbach and Raman mechanism. The former contribution is reported explicitly with a red line, while the latter is reported with a green line. Solid symbols of the same colors indicate the temperatures at which simulations were performed. The black circles report the experimental relaxation times obtained from AC susceptibility measurements in the absence of external field, for 6 K ≤ T ≤ 13 K, and from hysterisis loop at 1500 Oe external field, for T = 2 K. Dashed black lines corresponding to exp(Ueff/kBT), with Ueff = 130 and 16 cm–1 are reported in the bottom right part of the plot as a guide to the eye to interpret results.

