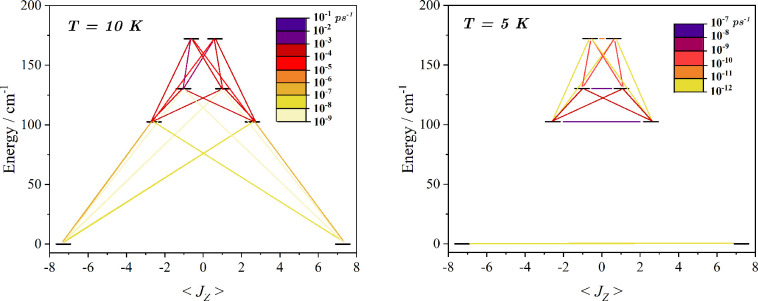
Figure 4.
Finite temperature Orbach and Raman computed transition rates. Right and left panel report the matrix elements of W1–ph and W2–ph, respectively, expressed in the basis of the eigenvectors of the ground KD’s g-tensor. On the x-axis, it is reported the computed average magnetic moment for the first four KDs and their energy separation from the ground state. All the rates are expressed in ps–1 and always refer to absorption rates. The emission rates are always found to be much larger because of the spontaneous emission contribution.

