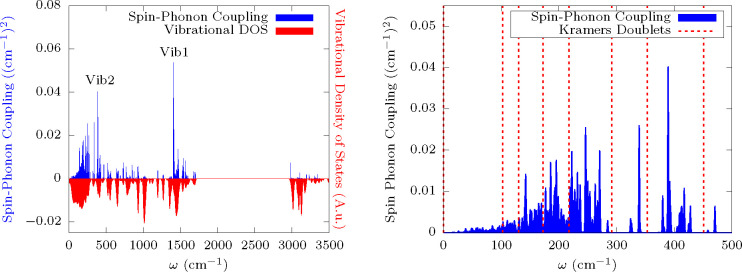
Figure 5.
Spin-phonon coupling distribution and vibrational density of states. The left panel reports the spin-phonon coupling distribution and the vibrational density of states as a function of energy. A Gaussian smearing with σ = 1 cm–1 and σ = 10 cm–1 has been applied to the two functions, respectively. The right panel is a close-up of the spin-phonon coupling distribution overlapped to the energy resonance of the KDs.

