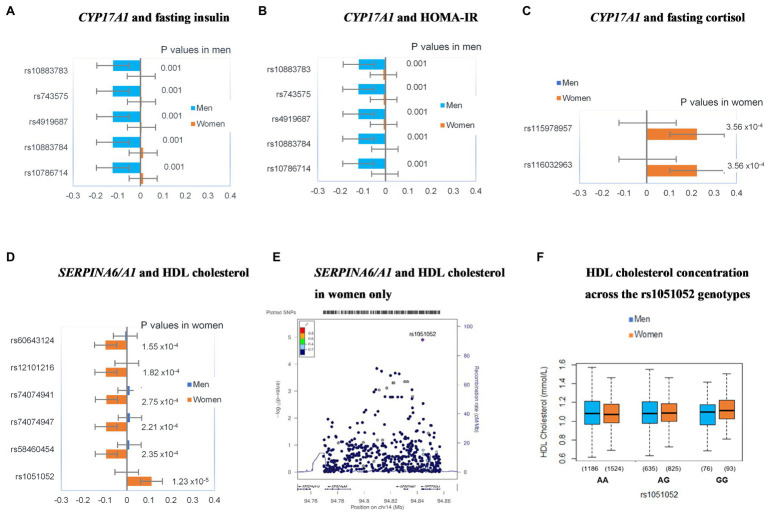
Figure 3.
Sex-specific genetic associations between CYP17A1 (A-C) and SERPINA6/A1 (D–F) variants and components of the metabolic syndrome. Plots (A-D) show standardized beta coefficients for the linear regression models after adjusting for age, smoking, alcohol, and BMI. Error bars in these plots represent 95% CIs for the standardized beta coefficients. Values of p are for the respective beta coefficients. The LocusZoom plot summarizes the association between rs1051052 and higher HDL cholesterol concentrations in women (E). The LocusZoom plot association data was plotted against the AFR LD backgrounds from the 1,000 Genomes Project phase 1 dataset. The rs1051052 SNP is represented by a purple diamond. Each SNP is colored according to the r2 value against rs1051052. SNPs with missing LD information are colored in gray. The box and whisker plot (F) shows the medians and IQRs of HDL cholesterol concentrations across the rs1051052 genotype groups in men and women. The number of observations in each group is shown in brackets.

