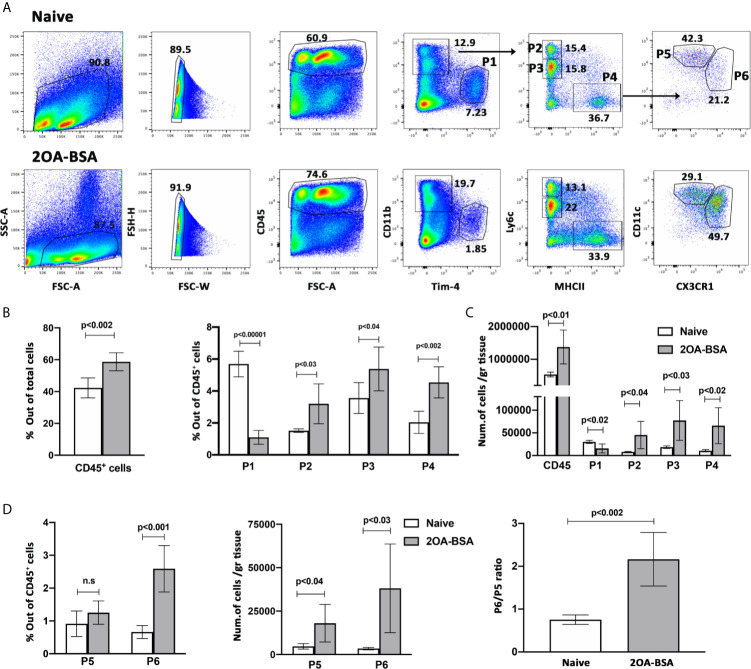
Figure 1.
Monocyte and monocyte-derived macrophages become the dominant subset of MNPs in the liver following induction of autoimmune cholangitis. (A) Representative flow cytometry analyses of purified non-parenchymal liver cells from naïve mice (upper panel) and 2OA-BSA immunized mice 8 weeks following immunization (lower panel). (B) Graphical summary of flow cytometry analysis of non-parenchymal liver cells; left graph summarizes the percentages of CD45-positive cells out of total cells and the right graph summarizes the percentages of each cell population out of CD45-positive cells. (C) Graphical summary of cells numbers normalized for liver tissue mass for CD45-positive cells and P1-P4 cell subsets. (D) Graphical summary of flow cytometry analysis showing the percentages of P5 and P6 cell populations out of CD45-positive cells (left panel), absolute cell numbers of P5 and P6 cell populations normalized for liver tissue mass (middle panel), and P6/P5 ratio (right panel), in naïve mice vs. 2OA-BSA immunized mice 8 weeks post immunization. Results presented as mean ± SEM (n≥5) for each group. Results are representative of two independent experiments. p values < 0.05 were considered as significant (unpaired Student’s t-test).

