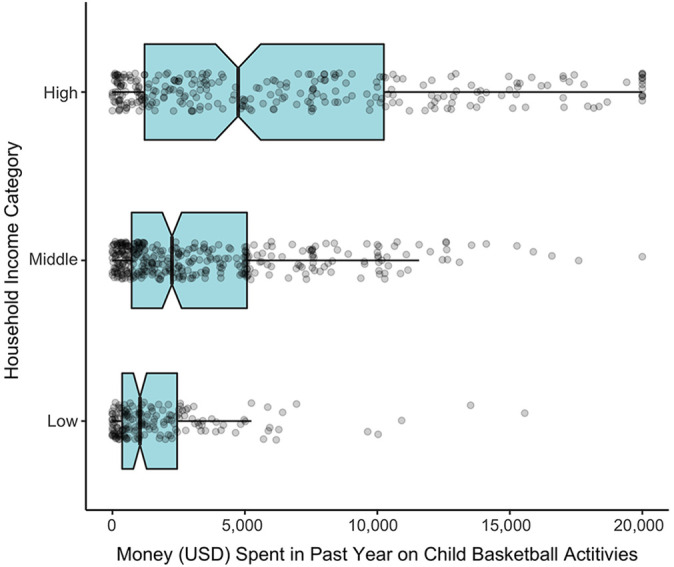
Figure 3.

Comparison of money spent in past year on child’s basketball activities between parent income categories. Box plots represent interquartile range (IQR), whiskers represent range of 1.5 times the IQR, line indicates median, notch displays 95% CI of the median and individual data points for each parent. USD, US dollar.
