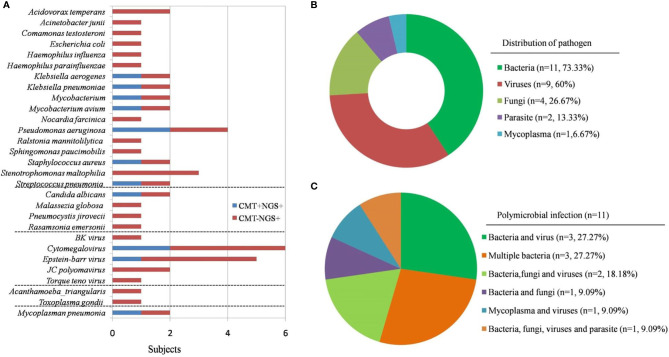
Figure 3.
Pathogens identified in PID patients using CMT and NGS. (A) The figure shows the number of subjects in whom each microbe was detected. Blue bars indicate microbes detected by CMT and predicted to be pathogens by NGS (CMT+NGS+). Red bars indicate microbes detected by NGS only (CMT−NGS+). (B) Distribution of pathogens in patients with PID. (C) Polymicrobial infection accounted for 73.33% of cases; different kinds of polymicrobial infection are shown.

