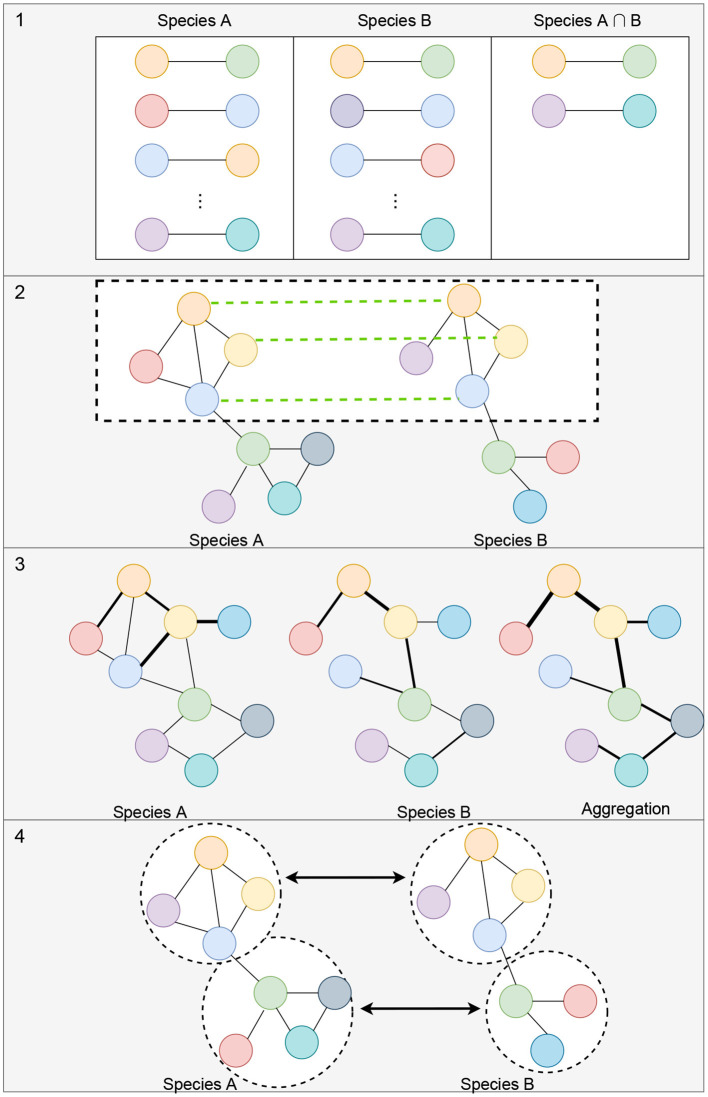
Figure 3.
Illustration of alignment-free strategies to measure the similarity between gene co-expression networks. (1) Measuring the topological similarities between networks. This could include identifying the conserved gene-pairs as shown in the illustration or more complex subgraph comparisons such as counting the number of conserved small subgraphs (3–5 nodes), like triangles, 2-stars, 3-stars, squares, or cliques. (2) Representation of methods that utilize orthologous links (shown with green links between the networks) to identify conserved modules of genes. (3) Example of comparison of edge weights or network aggregation where the nodes of the graph are automatically matched up and the edge weights aggregated to obtain a measure of similarity between the networks. (4) Module detection where each module can be compared using network connectivity and density statistics.

