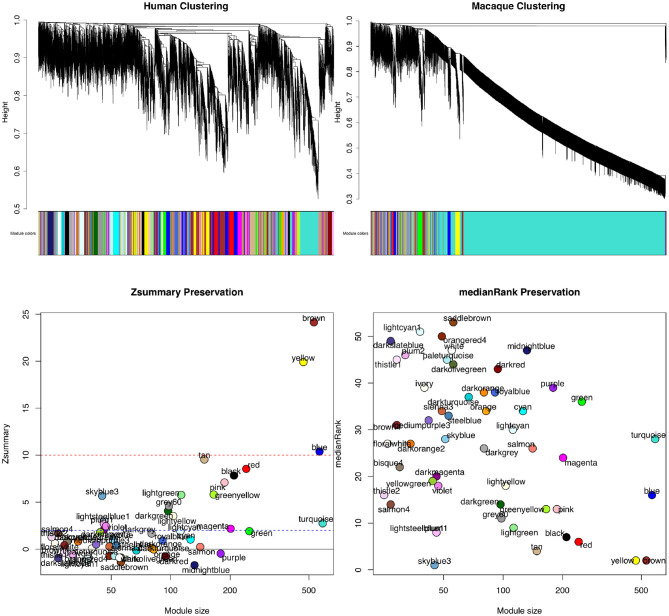
Figure 4.
Module preservation statistics comparing signed gene co-expression networks constructed using prefrontal cortex samples from human and macaque. To generate the networks, a power of β = 8 for soft thresholding was applied to create a scale-free network topology. The clustering merge height was set to 0.20 to generate the clusters shown in the dendrogram and module color images (top). The minimum module size allowed was 30 genes. From both Zsummary (bottom left) and medianRank (bottom right) preservation scores using mouse as the reference network, the most preservation is observed for the yellow and brown modules. A Zsummary score >2, but <10 indicates moderate preservation, while a score greater than 10 indicates strong module preservation. A low score for medianRank indicates high module preservation. One limitation of Zsummary score is that it often shows a dependence on module size meaning larger modules tend to get a higher score. It is also computationally intensive as it relies on permutation tests to determine significance. Although medianRank is not module size dependent like Zsummary, one drawback of medianRank is that it is rank based and therefore, it can only measure relative preservation. For example, the yellow and brown module with low medianRank scores may not be that well preserved, but it is the most preserved in comparison to the other modules discovered.

