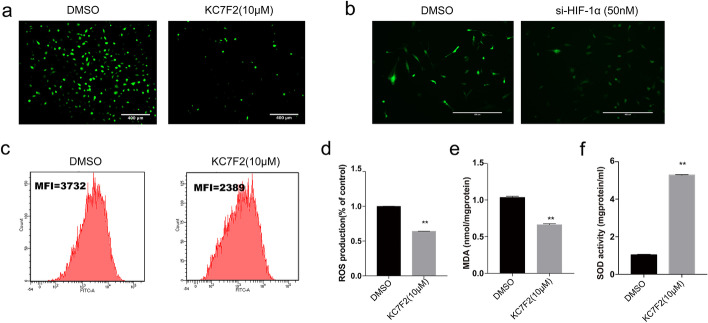
Fig. 4.
Effects of inhibition of HIF-1α expression on oxidative stress under hyperglycemia and hypoxia. Assays showing ROS (a–d), MDA (e) and SOD activity (f) compared with control. Downregulation of HIF-1α decreased expression of ROS and MDA, and increased SOD activity significantly compared with the control group following combined stimulation. n = 3; *p < 0.05 and **p < 0.01 vs. DMSO. DMSO-treated cells, DMSO; HIF-1α inhibitors KC7F2 (10 µM)-treated cells, KC7F2 (10 µM); si-HIF-1α, small interfering RNA HIF-1α; HG, high glucose; HG + Hypoxia, combined stimulus with high glucose and hypoxia; NG, control

