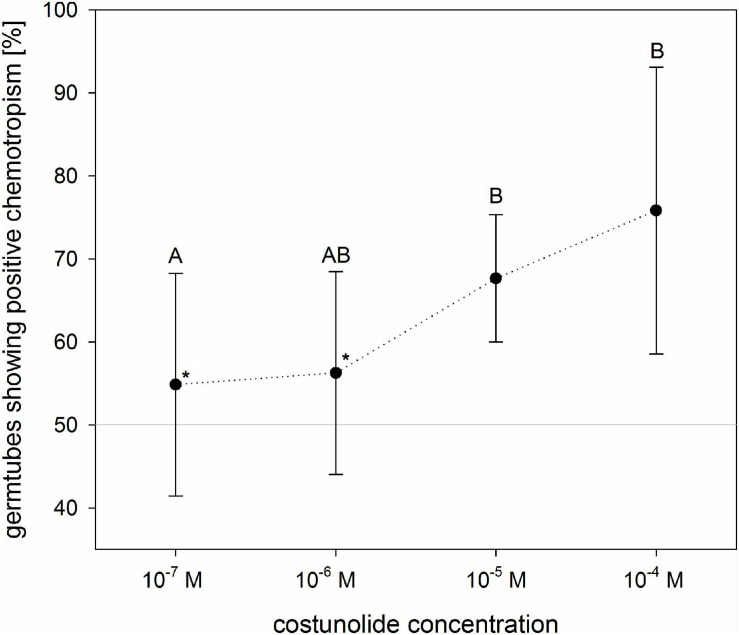
FIGURE 5.
Concentration dependence of O. cumana chemotropism toward costunolide. The values indicate concentrations applied to the filter discs (active concentrations at the seed surface are lower but undetermined). In tests with costunolide concentrations 10–6 M and 10–7 M, GR24 was added to ensure germination (asterisk). Means ± standard deviation of n = 3–6 replications. Same letter indicates that differences are not statistically significant (Tukey test, p < 0.05).

