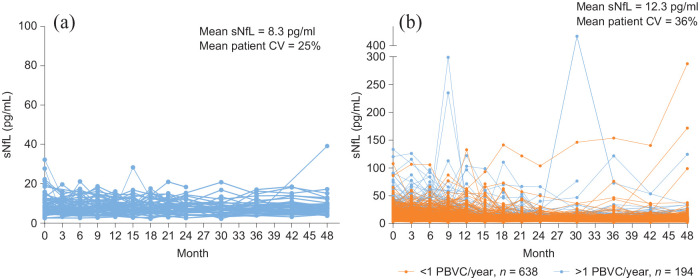
Figure 1.
sNfL levels across time in patients classified as exhibiting NEDA or EDA: (a) patients classified as exhibiting NEDA for the entire duration of the study, n = 65 (NEDA for 4 years) and (b) patients classified as exhibiting EDA at any time during the study, n = 832 (EDA over 4 years). The average annualized PBVC is based on data collected at 6 months and at 1, 2, 3, and 4 years. Each line represents the sNfL data for an individual patient.
CV: coefficient of variation; EDA: evidence of disease activity; NEDA: no evidence of disease activity; PBVC: percent brain volume change; sNfL: serum neurofilament light chain.

