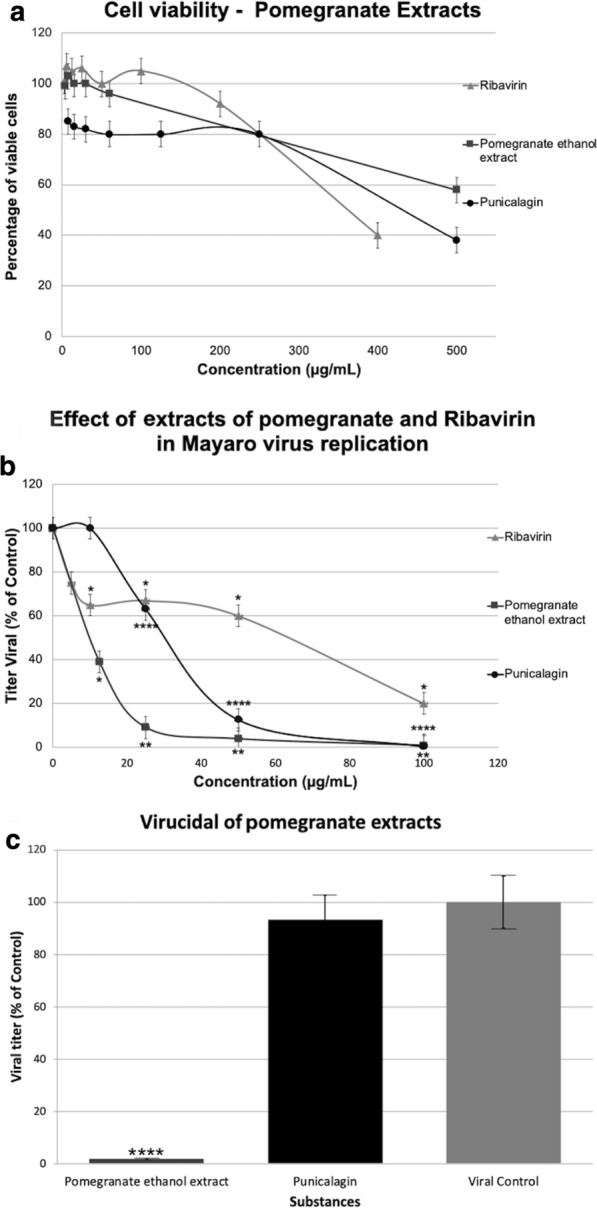
Fig. 2.

a Cytotoxic effect: the cytotoxicity of the substances was determined by the dye uptake technique, which consists of the incorporation of neutral red dye by living cells, where the substances were applied in an initial concentration of 2 mg/ml, and then serial dilutions were made up to the last well of the column in the 96-well plates. The values obtained in the reading were transformed into percentage of viable cells in each concentration of the cells treated with the substances compared to the control cells (untreated). The lead gray curve represents punicalagin, black represents ethanol extract of pomegranate, and gray represents ribavirin. y-axis, percentage of viable cells (Vero); x-axis, different concentrations of the substances. b Antiviral activity: confluent Vero cells were infected with a multiplicity of infection (MOI) of 0.1 for 1 h. After adsorption, culture medium was added without the substances in the viral control and with the substances at the concentrations indicated in the experiment. After 24 h, the supernatant was collected and titrated by the TCID50 titration method. The lead gray curve represents punicalagin, black represents ethanol extract of pomegranate, and gray represents ribavirin. y-axis, virus titer; x-axis, the different concentrations of the substances. One-way analysis of variance (ANOVA) followed by Dunnett’s multiple comparisons test (P < 0.05) was used in the capture experiments, and Dunnett’s test (*P < 0.05; **P < 0.01; ****P < 0.0001) was used to compare the viral inhibition between the control viral and other concentrations of ethanol extract from pomegranate and punicalagin. Cells were treated with 12.5, 25, 50, and 100 µg/ml of ethanol extract of pomegranate and punicalagin at 24 h post-infection. The y-axis bar graph shows the viral titer in % of control ; the x-axis shows the concentrations of extract on the left and the different ethanol extracts of pomegranate concentrations on the right, 12.5, 25, 50, and 100 µg/ml One-way analysis of variance (ANOVA) followed by Dunnett's multiple comparison test (P < 0.05) was used in the capture experiments, and Dunnett’s test (*P < 0.05) was used to compare the viral inhibition between the control viral with other concentrations of ribavirin. Cells were treated with 12.5, 25, 5 0, and 100 µg/ml of ethanol extract of pomegranate at 24 h post-infection. The y-axis bar graph shows the viral titer in % of control; the x-axis shows the concentrations of extract on the left and the different extracts of pomegranate concentrations on the right, 25, 50, 100, 200, 400 µg/ml. c Virucidal activity: in order to evaluate whether the tested substances have a “virucidal” effect, that is, they interact directly with the viral particle, the substances (at the concentration of twice the value that obtained the best activity) were incubated with the virus at a final concentration of approximately 100 PFU/ml for 1 h at 37 °C. Soon after this treatment, this inoculum was titrated by plaque assay. Vero cell monolayers were treated with the substances at a concentration of 200 µg/ml: x-axis, the substances, ethanol extract of pomegranate, punicalagin, and viral control (VC). y-axis, percentage of virus titer. One-way analysis of variance (ANOVA) followed by Dunnett’s multiple comparison test (P < 0.05) was used in the capture experiments, and Dunnett’s test (****P < 0.0001) was used to compare the viral inhibition between control viral with other concentrations of ethanol extract of pomegranate and punicalagin
