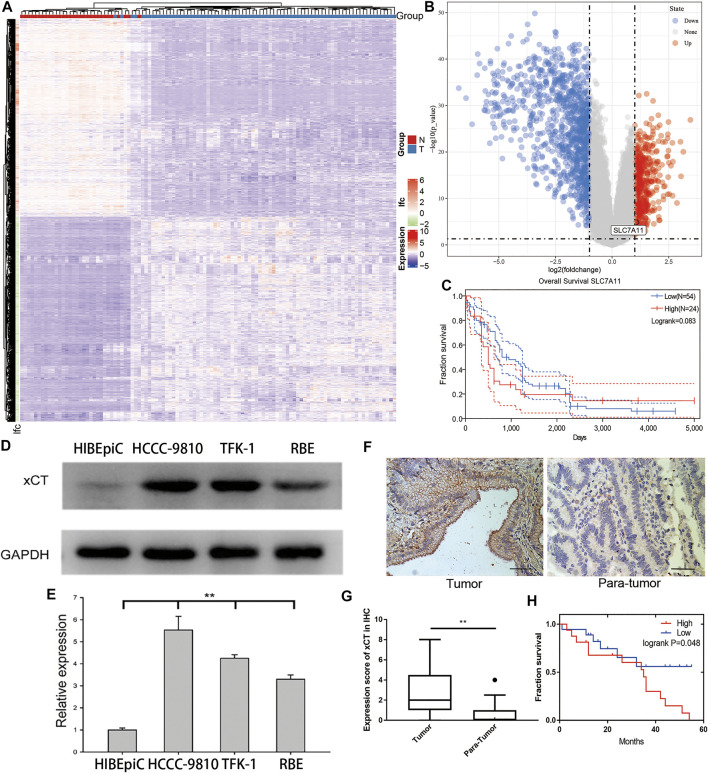
FIGURE 1.
The expression of xCT in cholangiocarcinoma and its relationship with the prognosis of patients. (A,B) Differential gene heat map and volcano map from the E-MTAB-6389 dataset which include 78 tumour (T group) and 31 adjacent tissue (N group) samples with high and low expression; xCT (SLC7A11) is marked. (C) Survival analysis of xCT in the E-MTAB-6389 dataset. (D,E) xCT expression levels and histograms in normal bile duct epithelium HIBEpiC cells and cholangiocarcinoma HCCC-9810, TFK-1 and RBE cells. (F,G) The represent images and histogram of xCT in cholangiocarcinoma tumour and adjacent tissues (34 pairs). (H) Survival analysis showed the effect of different expression levels of xCT on the survival time of patients with cholangiocarcinoma (High, high expression group; Low, low expression group).

