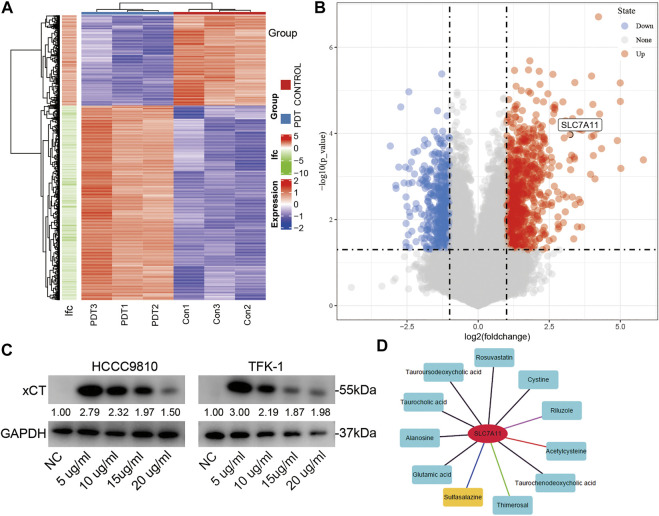
FIGURE 3.
The expression of xCT changes after PDT treatment. (A,B) The heatmap and volcano map of the differential genes after PDT treatment; xCT (SLC7A11) is marked. (C) After treatment with different concentrations of PHP-PDT, the expression of xCT in HCCC-9810 and TFK-1 cells was different. (D) Potential drug targets of xCT.

