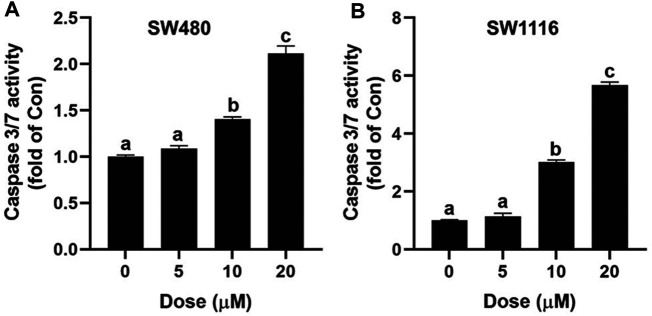
FIGURE 5.
Effect of ivermectin on Caspase 3/7 in SW480 and SW1116 cells. SW480 (A) and SW1116 (B) cells were treated with different concentrations of ivermectin (0, 5, 10, and 20 μM) for 6 h, and then the Caspase 3/7 activity was measured described in the “Materials and Methods” section. Data were analyzed using one-way ANOVA following Tukey’s t-test. The data are shown as the means ± SD of three independent experiments. (a–c): same letters, no statistical difference; different letters, the statistical difference (p < 0.05). IVM, ivermectin.

